Dayton Signature 10”
2 Likes
Aerial Acoustics 10” subwoofer, PE buyout from 5 or 6 years ago.
And that is all my 10” drivers. I don’t know if I will be testing any of my smaller drivers just yet.
It uses a DC bias offset in the internal amp to position the cone and takes the sweep there. I assume some fancy algorithms take over from there.
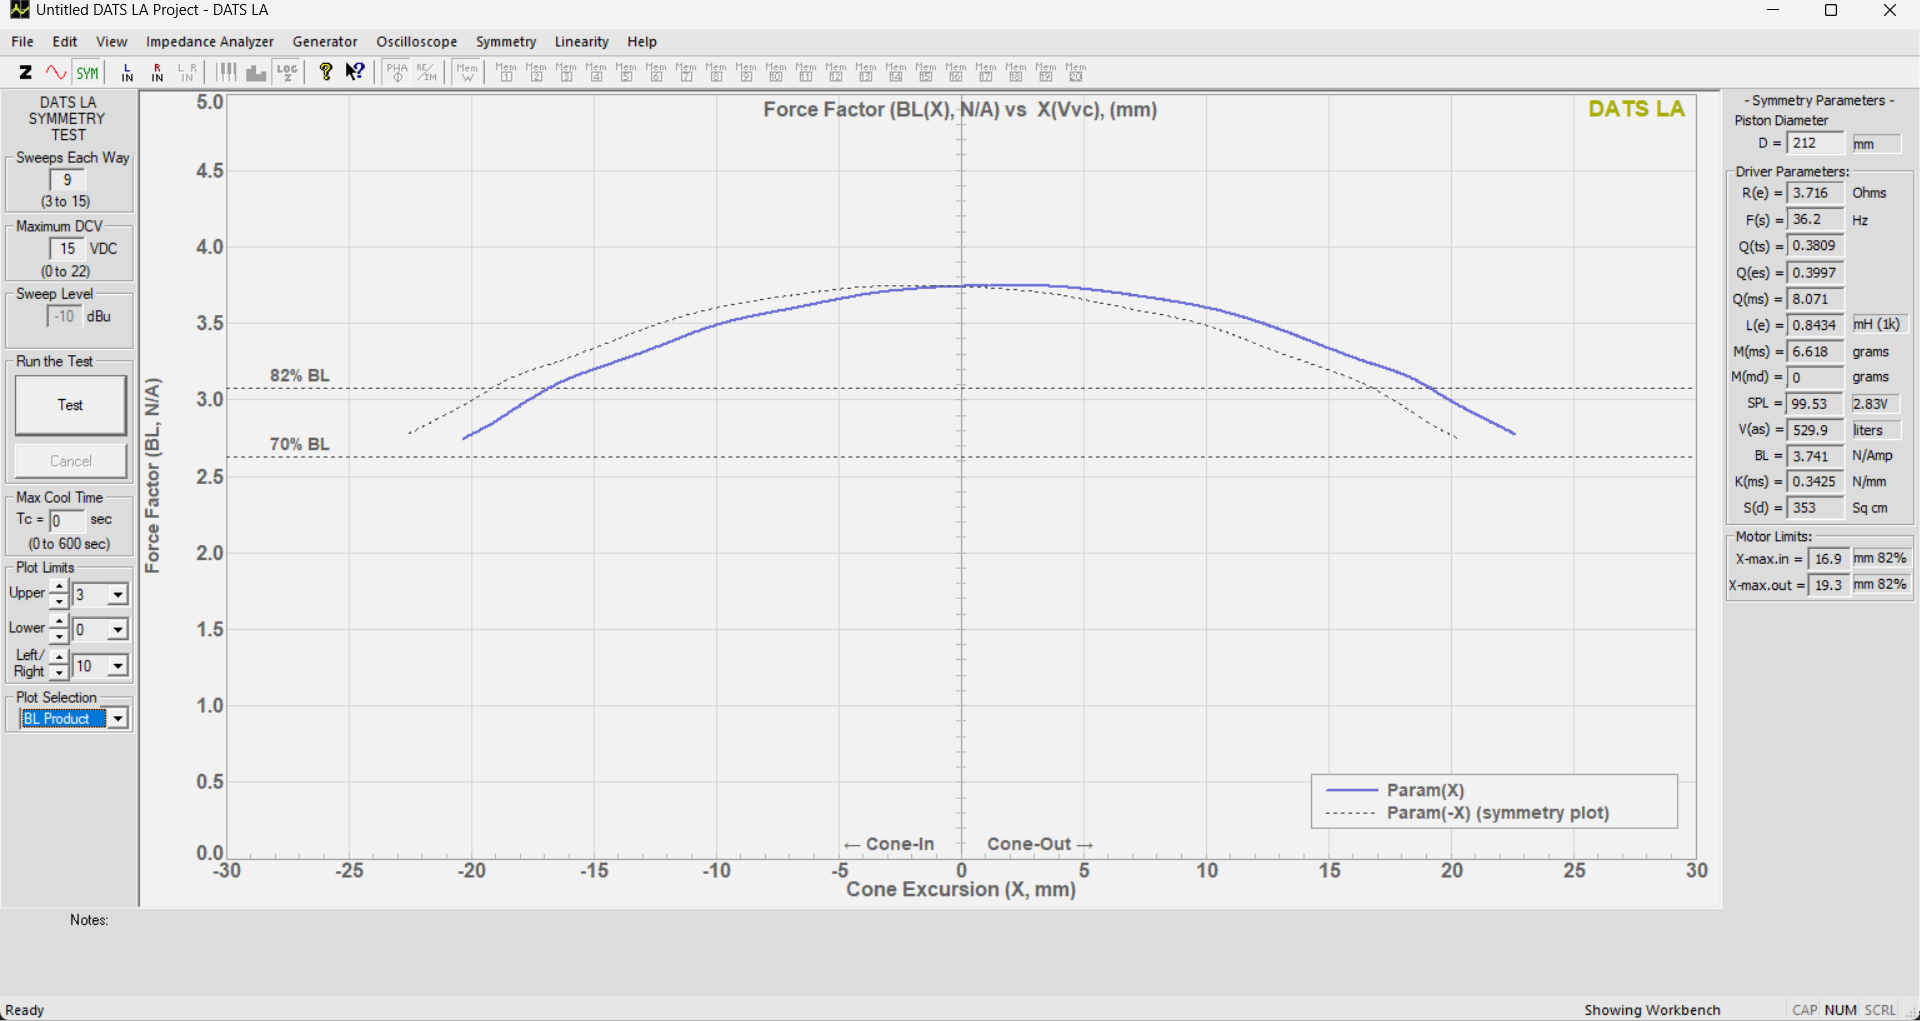
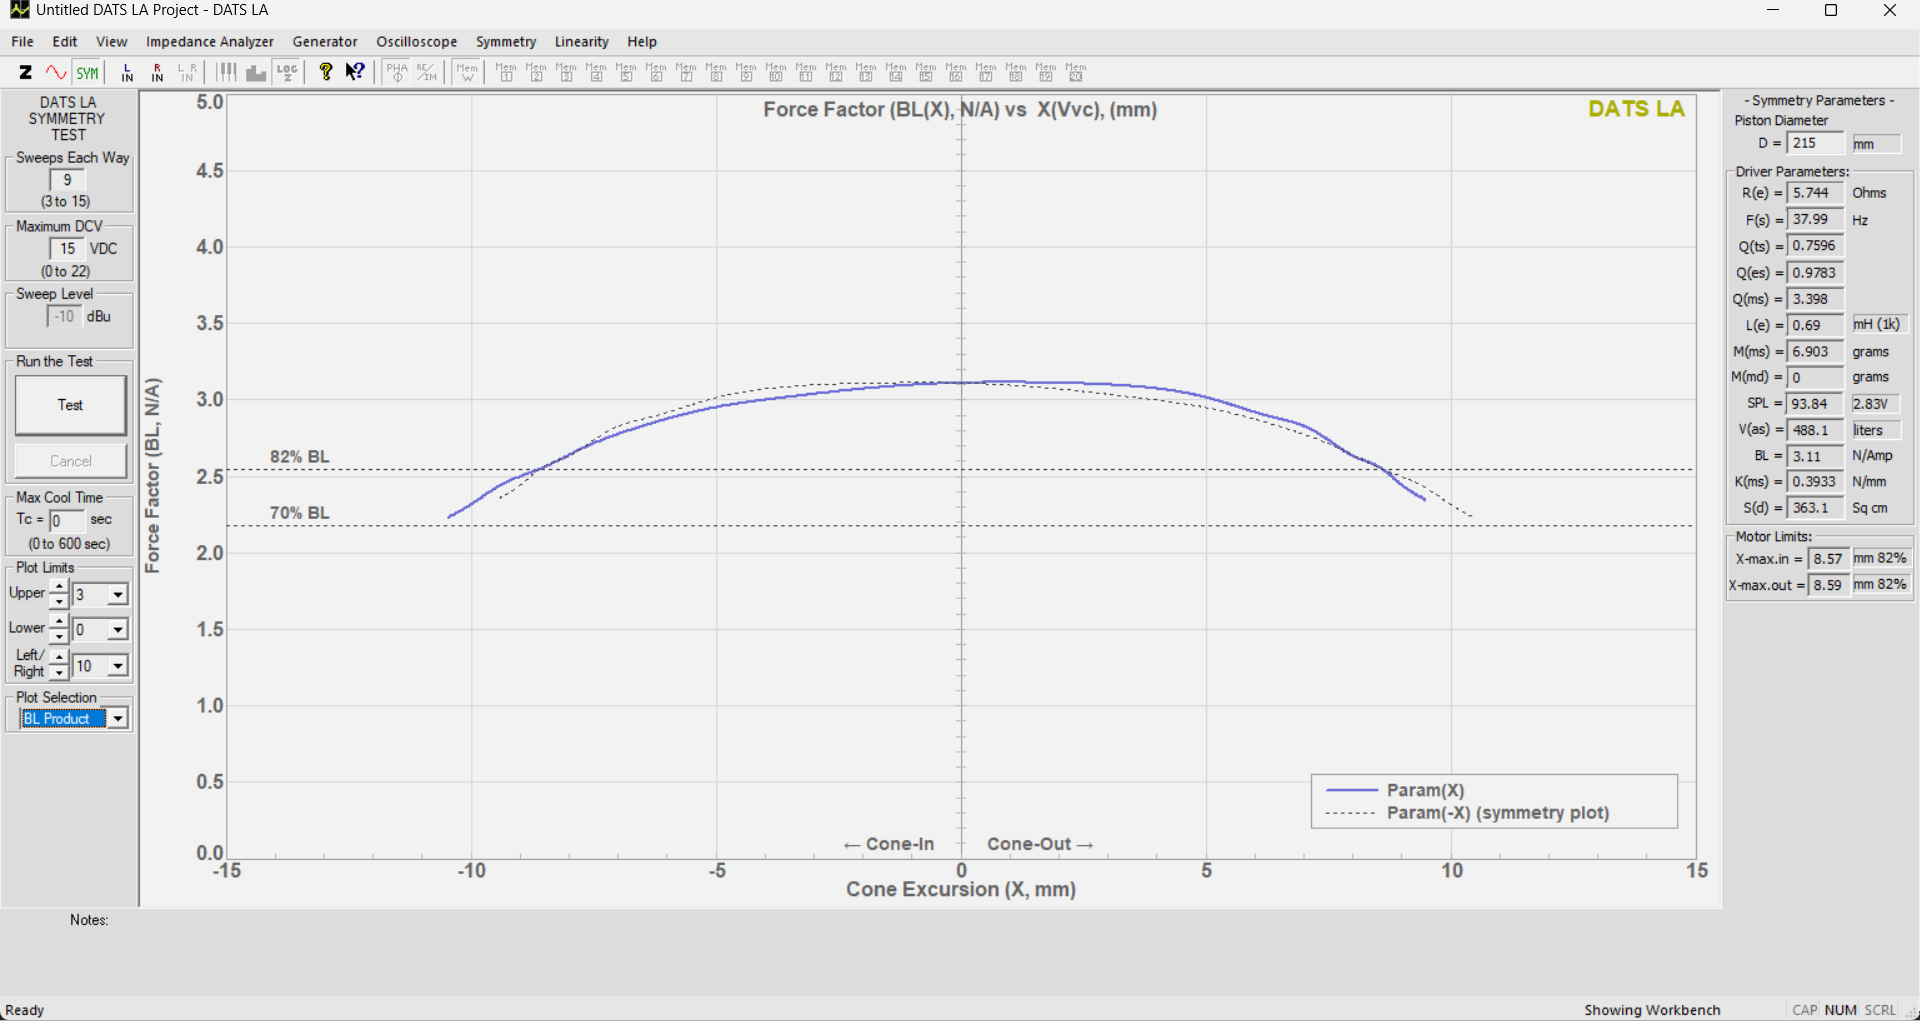
How to interpret the data?
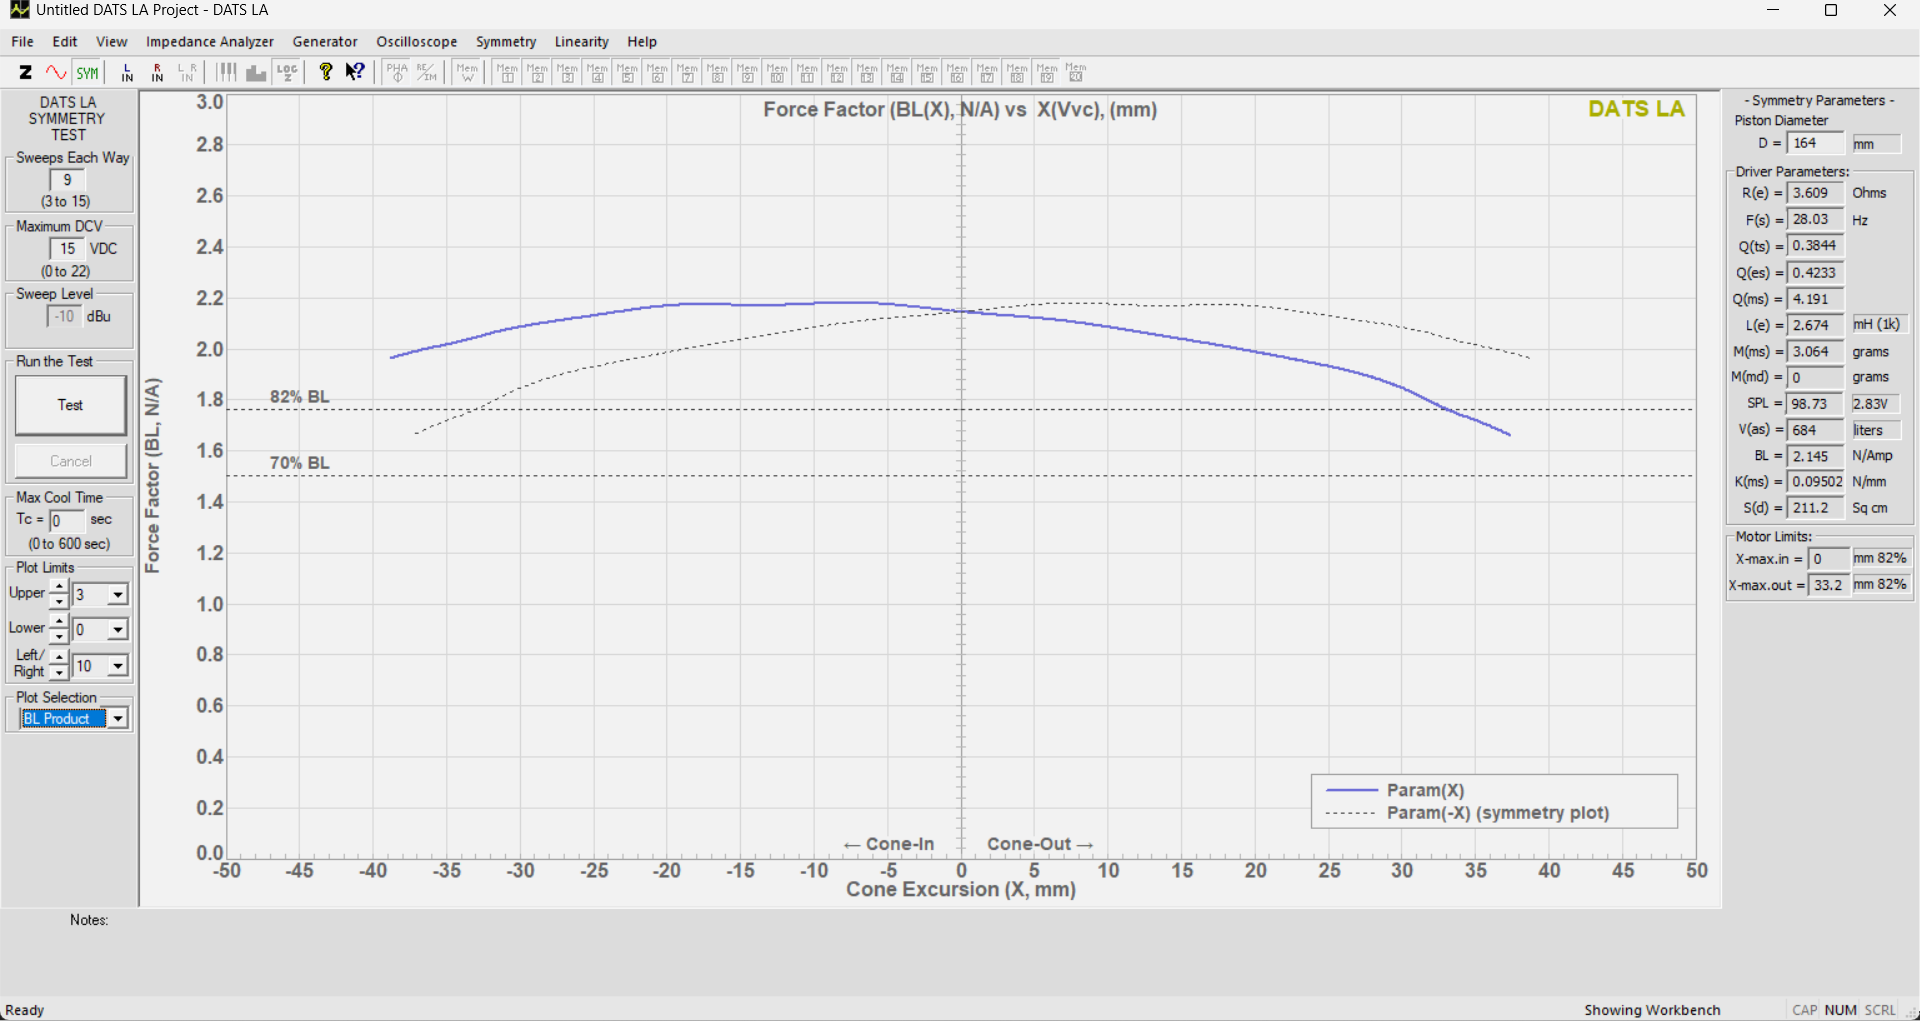
Im hoping someone more eloquent than I will chime in on reading these types of graphs.
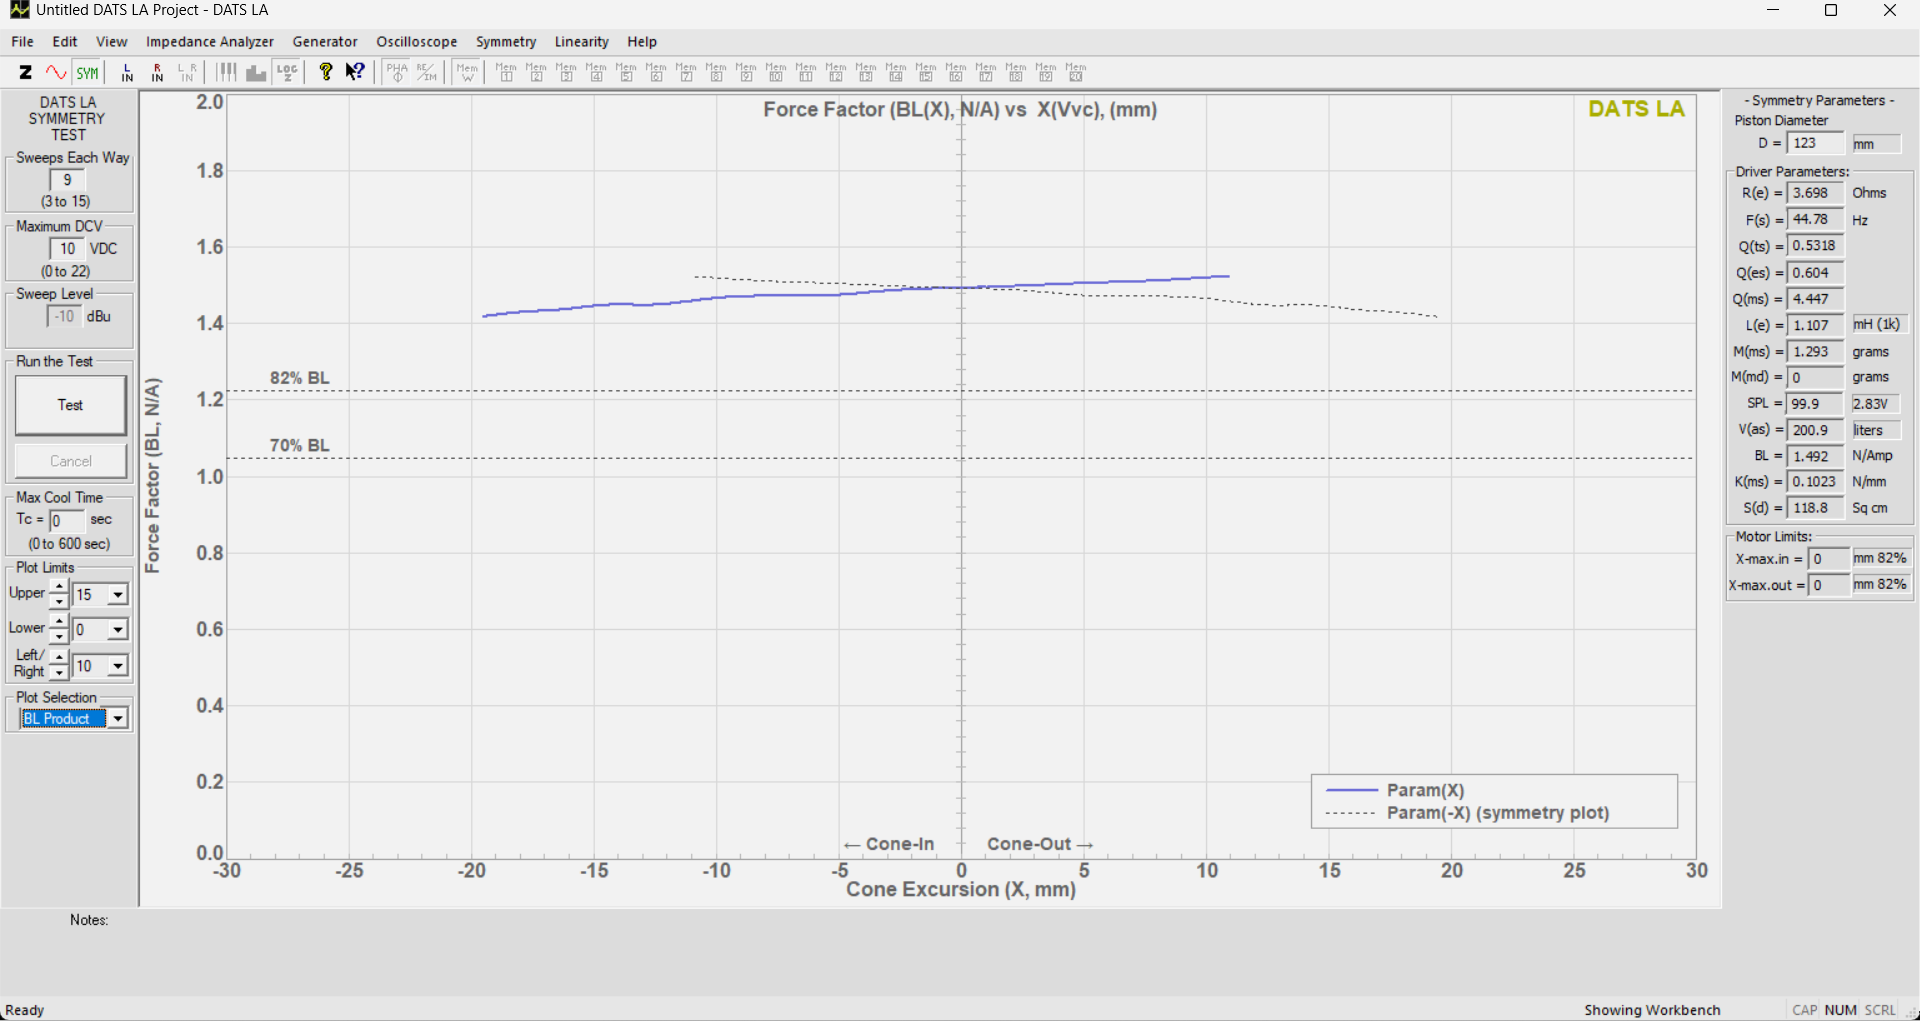
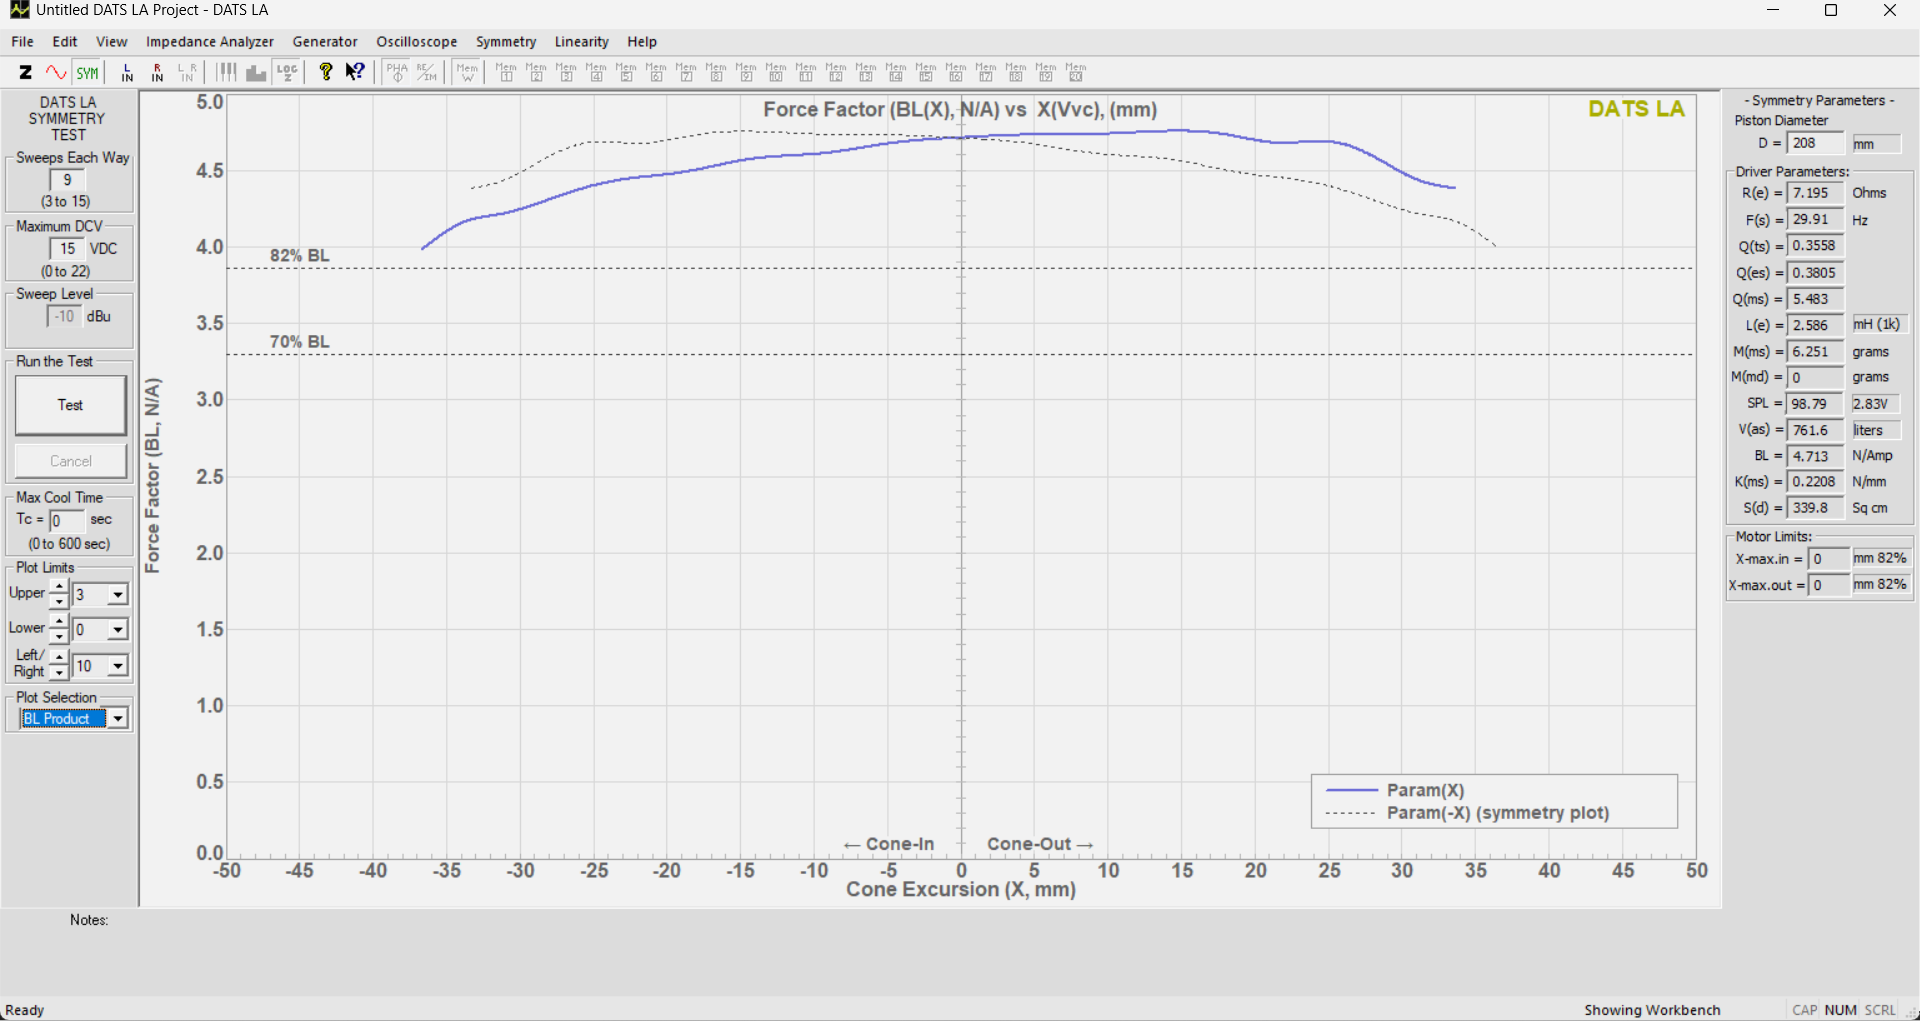
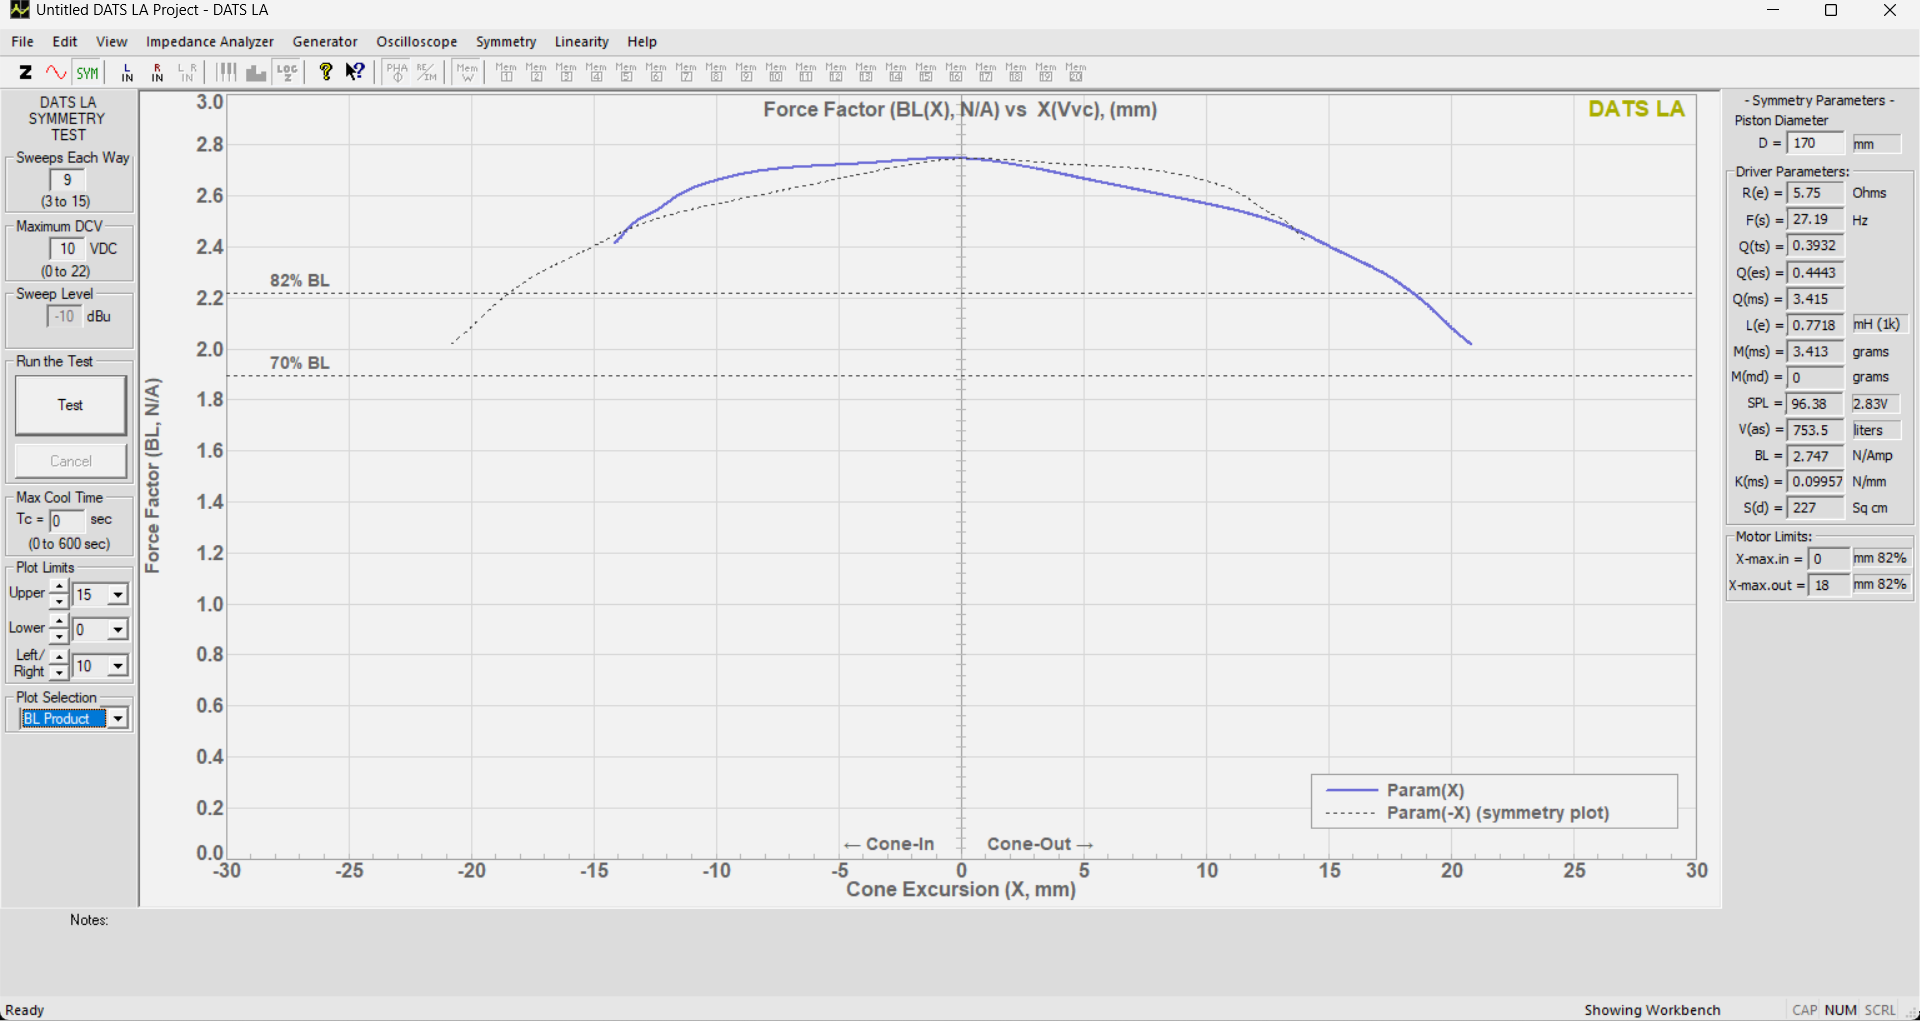
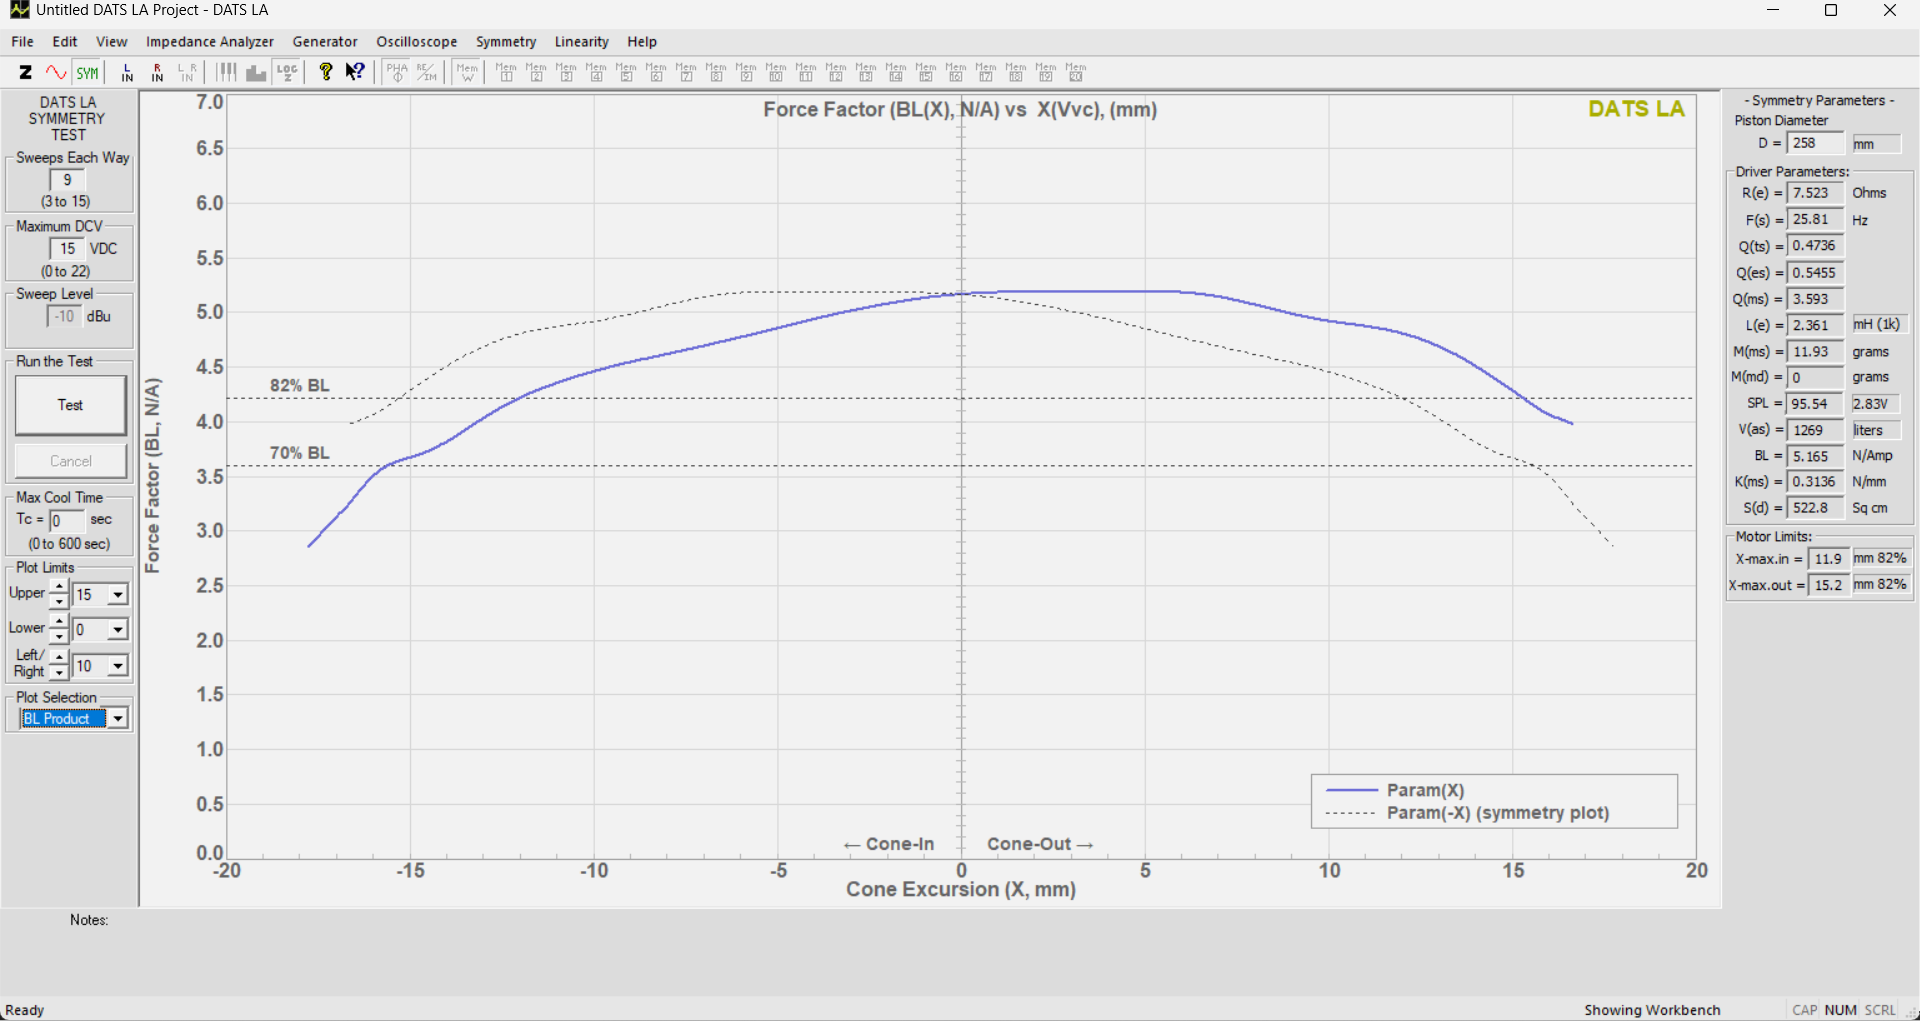
As I said, I am offering these commentary free - so I will leave it up to you fine folks to speculate as to why some of the drivers seem to have failed at generating a Bl curve. I’m puzzled.
Realistic 12” DVC subwoofer, original issue with lots more Xmax than the ones branded “Radio Shack” that came later.
Here is a video by Brian Myers which helps a little. I’m still trying to figure out the difference between the two curves (solid blue line verses the dotted line). The solid blue line is “Param (X)” and the dotted line is “Param (-X) (symmetry plot)”. Currently looking for definitions in the DATS LA manual, but coming up empty so far..
Why are the Vas figures so huge?
Pay no attention to that, from what I understand. On “normal” mode Vas measures correctly.
1 Like
The dotted line is just the solid blue line flipped 180deg along the Y axis. It just shows how symmetrical (or asymmetrical) the curve is. The more they overlap, the more symmetrical the curve is.
1 Like
Hmmm….doesnt seem very accurate. I’m sure the GRS 8 HE is a fine sub, but I suspect it doesn’t have 35mm+ Xmax @ 82%. And all of the BL values on the Y axis seem very low
Something looks wonky. For the W6-1139SIF DATS shows Mms as 1.3 grams while Tangband lists it at 39.9 grams.
Pay no attention to the TS on the Bl sweeps.
Hey JR, what is the method you use for holding these in place while keeping the rear ‘open’. From my limited experience (you’ve tested way more drivers than I!) it seemed having a decent clamping system benefited the results a bit.
I use nothing but gravity, to be honest.