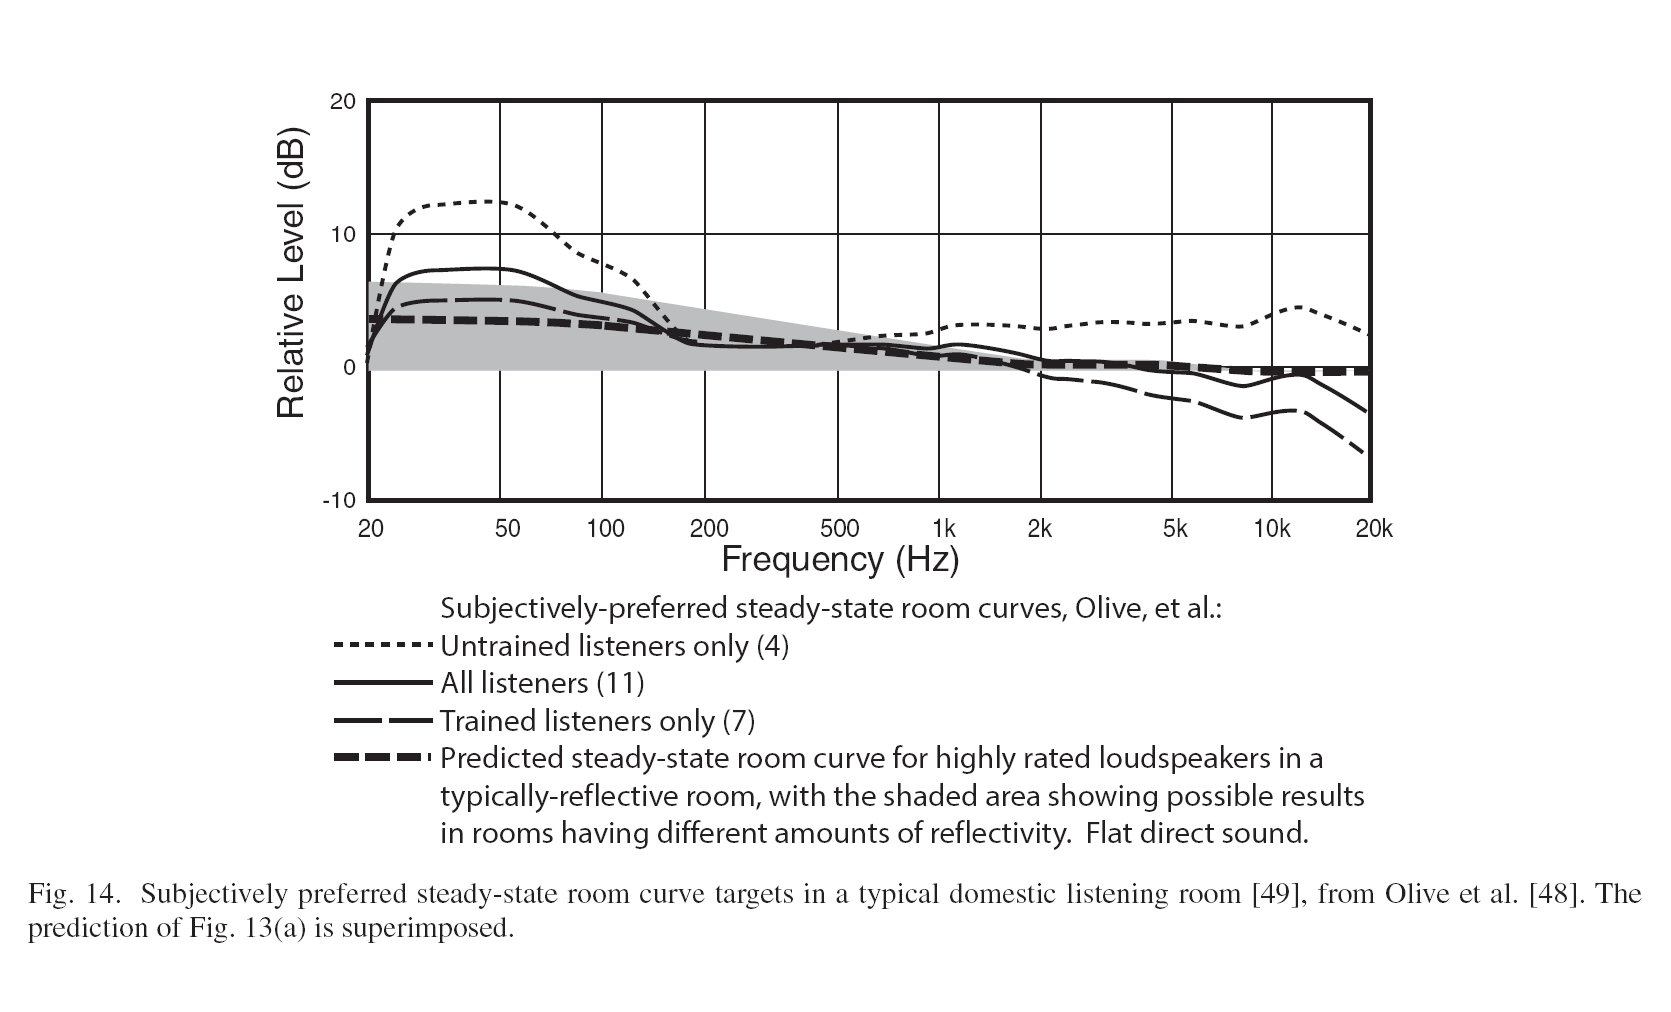
OK, I will start by offering up this plot and the source where I found it. It is a plot of data collected in a study done by Sean Olive, reported in a comprehensive paper by Toole, only part of which is related to domestic listening spaces (see section 4: SMALL VENUE SOUND SYSTEMS starting on page 526).
I think about this plot a lot, and also use it when voicing my own loudspeaker projects. As I understand it, the data was collected using a long integration time in a room with various loudspeakers playing. These speakers were judged by various types of listeners who are categorized by whether they are “trained listeners” or just casual or naive listeners. The results are averaged into one of the curves mentioned.
You would get data like this if you measured the in-room response of your voiced loudspeaker with a continuous signal like white noise and averaged the LF response across the room. You can do this with ARTA, for example. So it includes BOTH the response of the speaker and the room, but that is exactly what your ears are hearing and so it should be rather useful. If you want the full details on how the data was collected you will need to go back to the source and find it but I think the original Olive paper is not online.
There are several features to note in the plot. The bass region below 100Hz is characterized by a rapid rise in level by 3dB or more (it varies by the type of listener). From 100Hz to around 1kHz the level remains approximately constant. Between 1k and 2k Hz there is a down-step of about 1.5dB. Above 2kHz the response is either relatively flat, or trends down with increasing frequency and the amount is again listener type dependent.
How does the room influence these curves? At low frequency with a boxed loudspeaker there can be some room pressurization happening below about 80Hz. So likely the elevated levels down there are reflecting how the room and speaker with flat response interact at low frequency. At high frequencies, I understand that the typical domestic space starts to absorb the off-axis radiation from the loudspeaker (via furniture, carpet, drapes, etc.) so this might influence the down-tilt at high frequencies in the total “in room” sound when the speaker itself is voiced flat.
Then there is the step-down around 1k-2k Hz. I have talked to some of you in the past and heard that you sometimes do this exact sort of step down when voicing your projects, so that the speaker does not sound too bright, etc.
My own projects are dipole in nature. Along with no spoon, there is no box. I carefully choose drivers and crossover points so that the speaker radiates the same or as similar as possible in both directions. Also, I try to have a listening space with plain, reflective walls. Definitely the front wall, but also the floor and side walls. Other surfaces and the rear wall are absorptive to mitigate the room decay time. My speaker will have nearly constant power response but cannot pressurize the room at LF. When voiced flat or nearly so it sounds too bright to me. So I use the data in the plot, and some other information I have found, to create a voicing EQ curve that makes the speaker sound more engaging, less fatiguing, and balanced on a wide variety of music sources.
One can always voice by ear using some carefully picked recordings, but it is useful to have a guide as to what to shoot for, and why. These are my current thoughts about voicing, the how and why, etc. But I would like to hear from others about how they get their own projects to sound right to them, and if there is any method that they follow.
Toole - The Measurement and Calibration of Sound Reproducing Systems.pdf (1.7 MB)