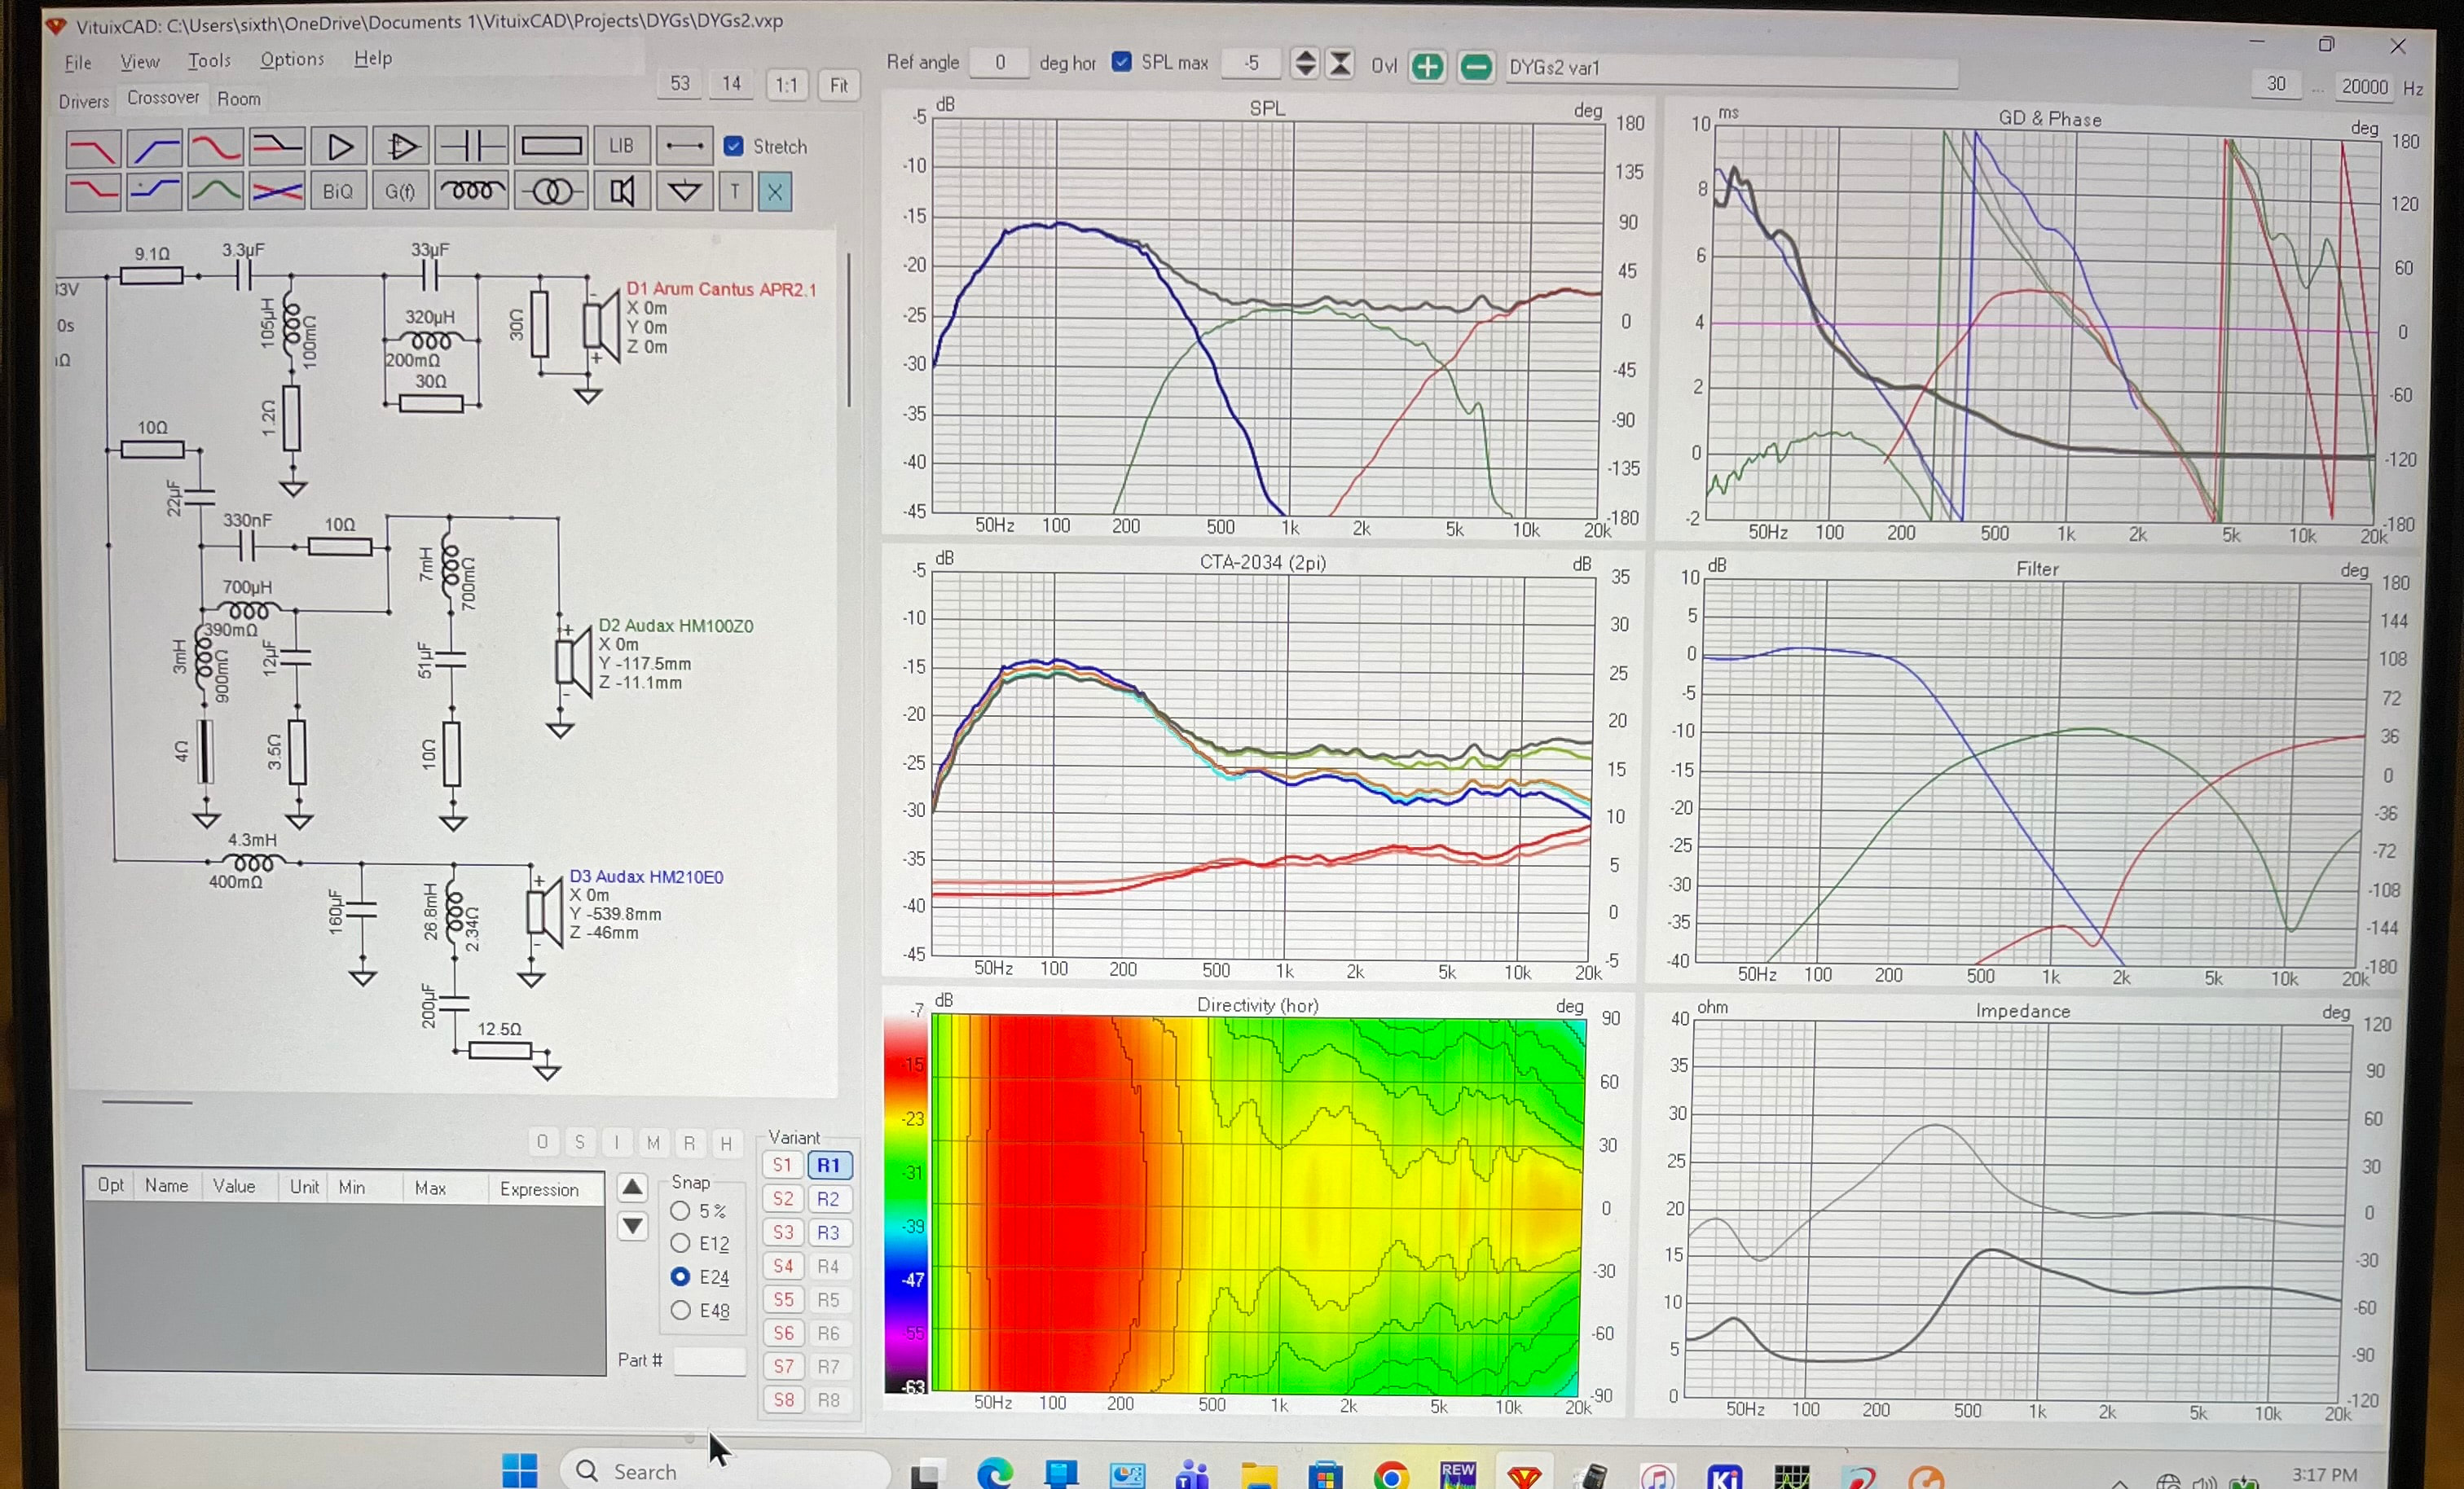
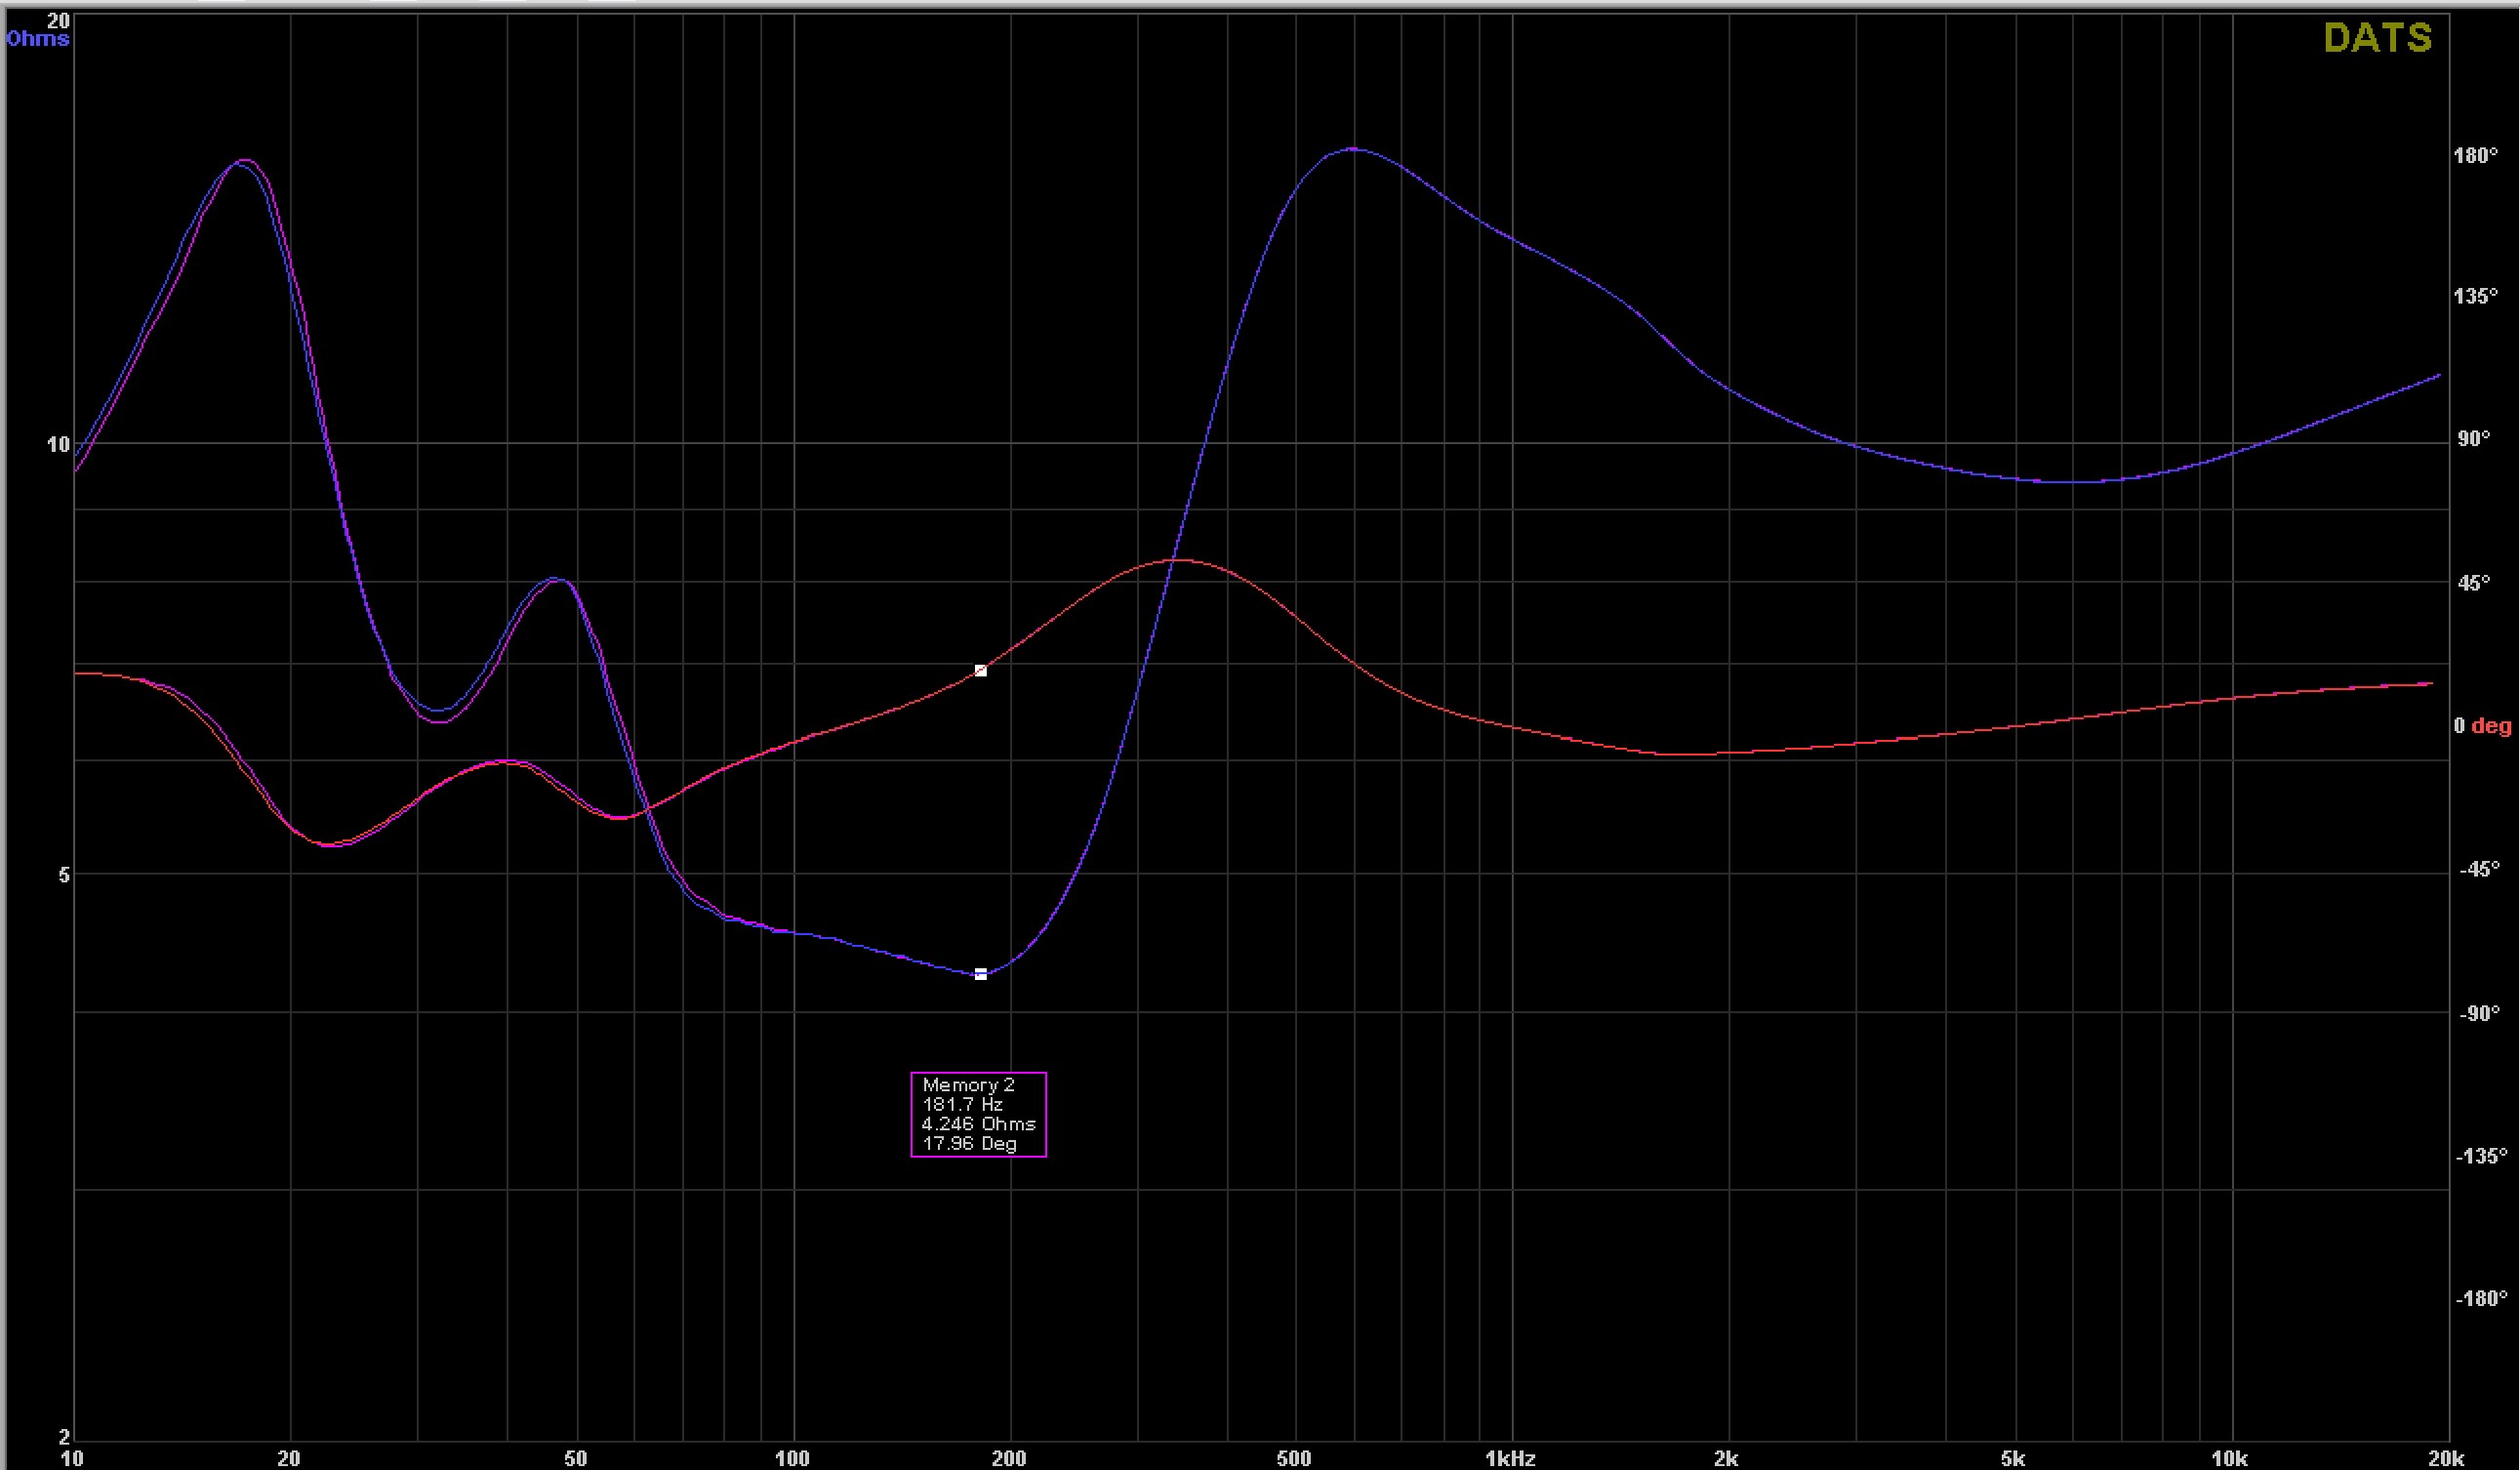
It can be distracting, but try not to focus too closely on the “wraps”, it’s really not as significant of an event as it looks, is simply the way the phase is plotted, the wrap-around is just change from 180 degrees to 181 degrees. So when you invert the response, all the zero crossing points become the 180 degree wrapping points and vice versa.
In the first image, phase is aligned at 4kHz, both traces are at -180 degrees. In the second image, it is aligned at 4kHz as well, at 0 degrees, or 180 degrees from previous.
In the first image, at 10kHz, green trace is about 100 degrees, red trace is at -60. In the second image, without looking we can assume green trace is 100 degrees - 180 = -80 degrees. Red trace is -60 - 180 = -240, or “wrapped around” to +120.
@6thplanet - rather than taking a pic of the laptop screen, use the “Snipping tool”. Press SHIFT+START+S (or Windows key instead of START, depending on how it is labeled) and select the area you want to “snip”. Click SAVE (the little floppy disk icon) to save as *.png.
Thanks David. Maybe I’ll get VC yet.
But since I can only measure in an 8 foot tall room, I can really only measure quasi-anechoically at about 1 meter, so how to handle VCs insistence on 2 meter measurements / sims
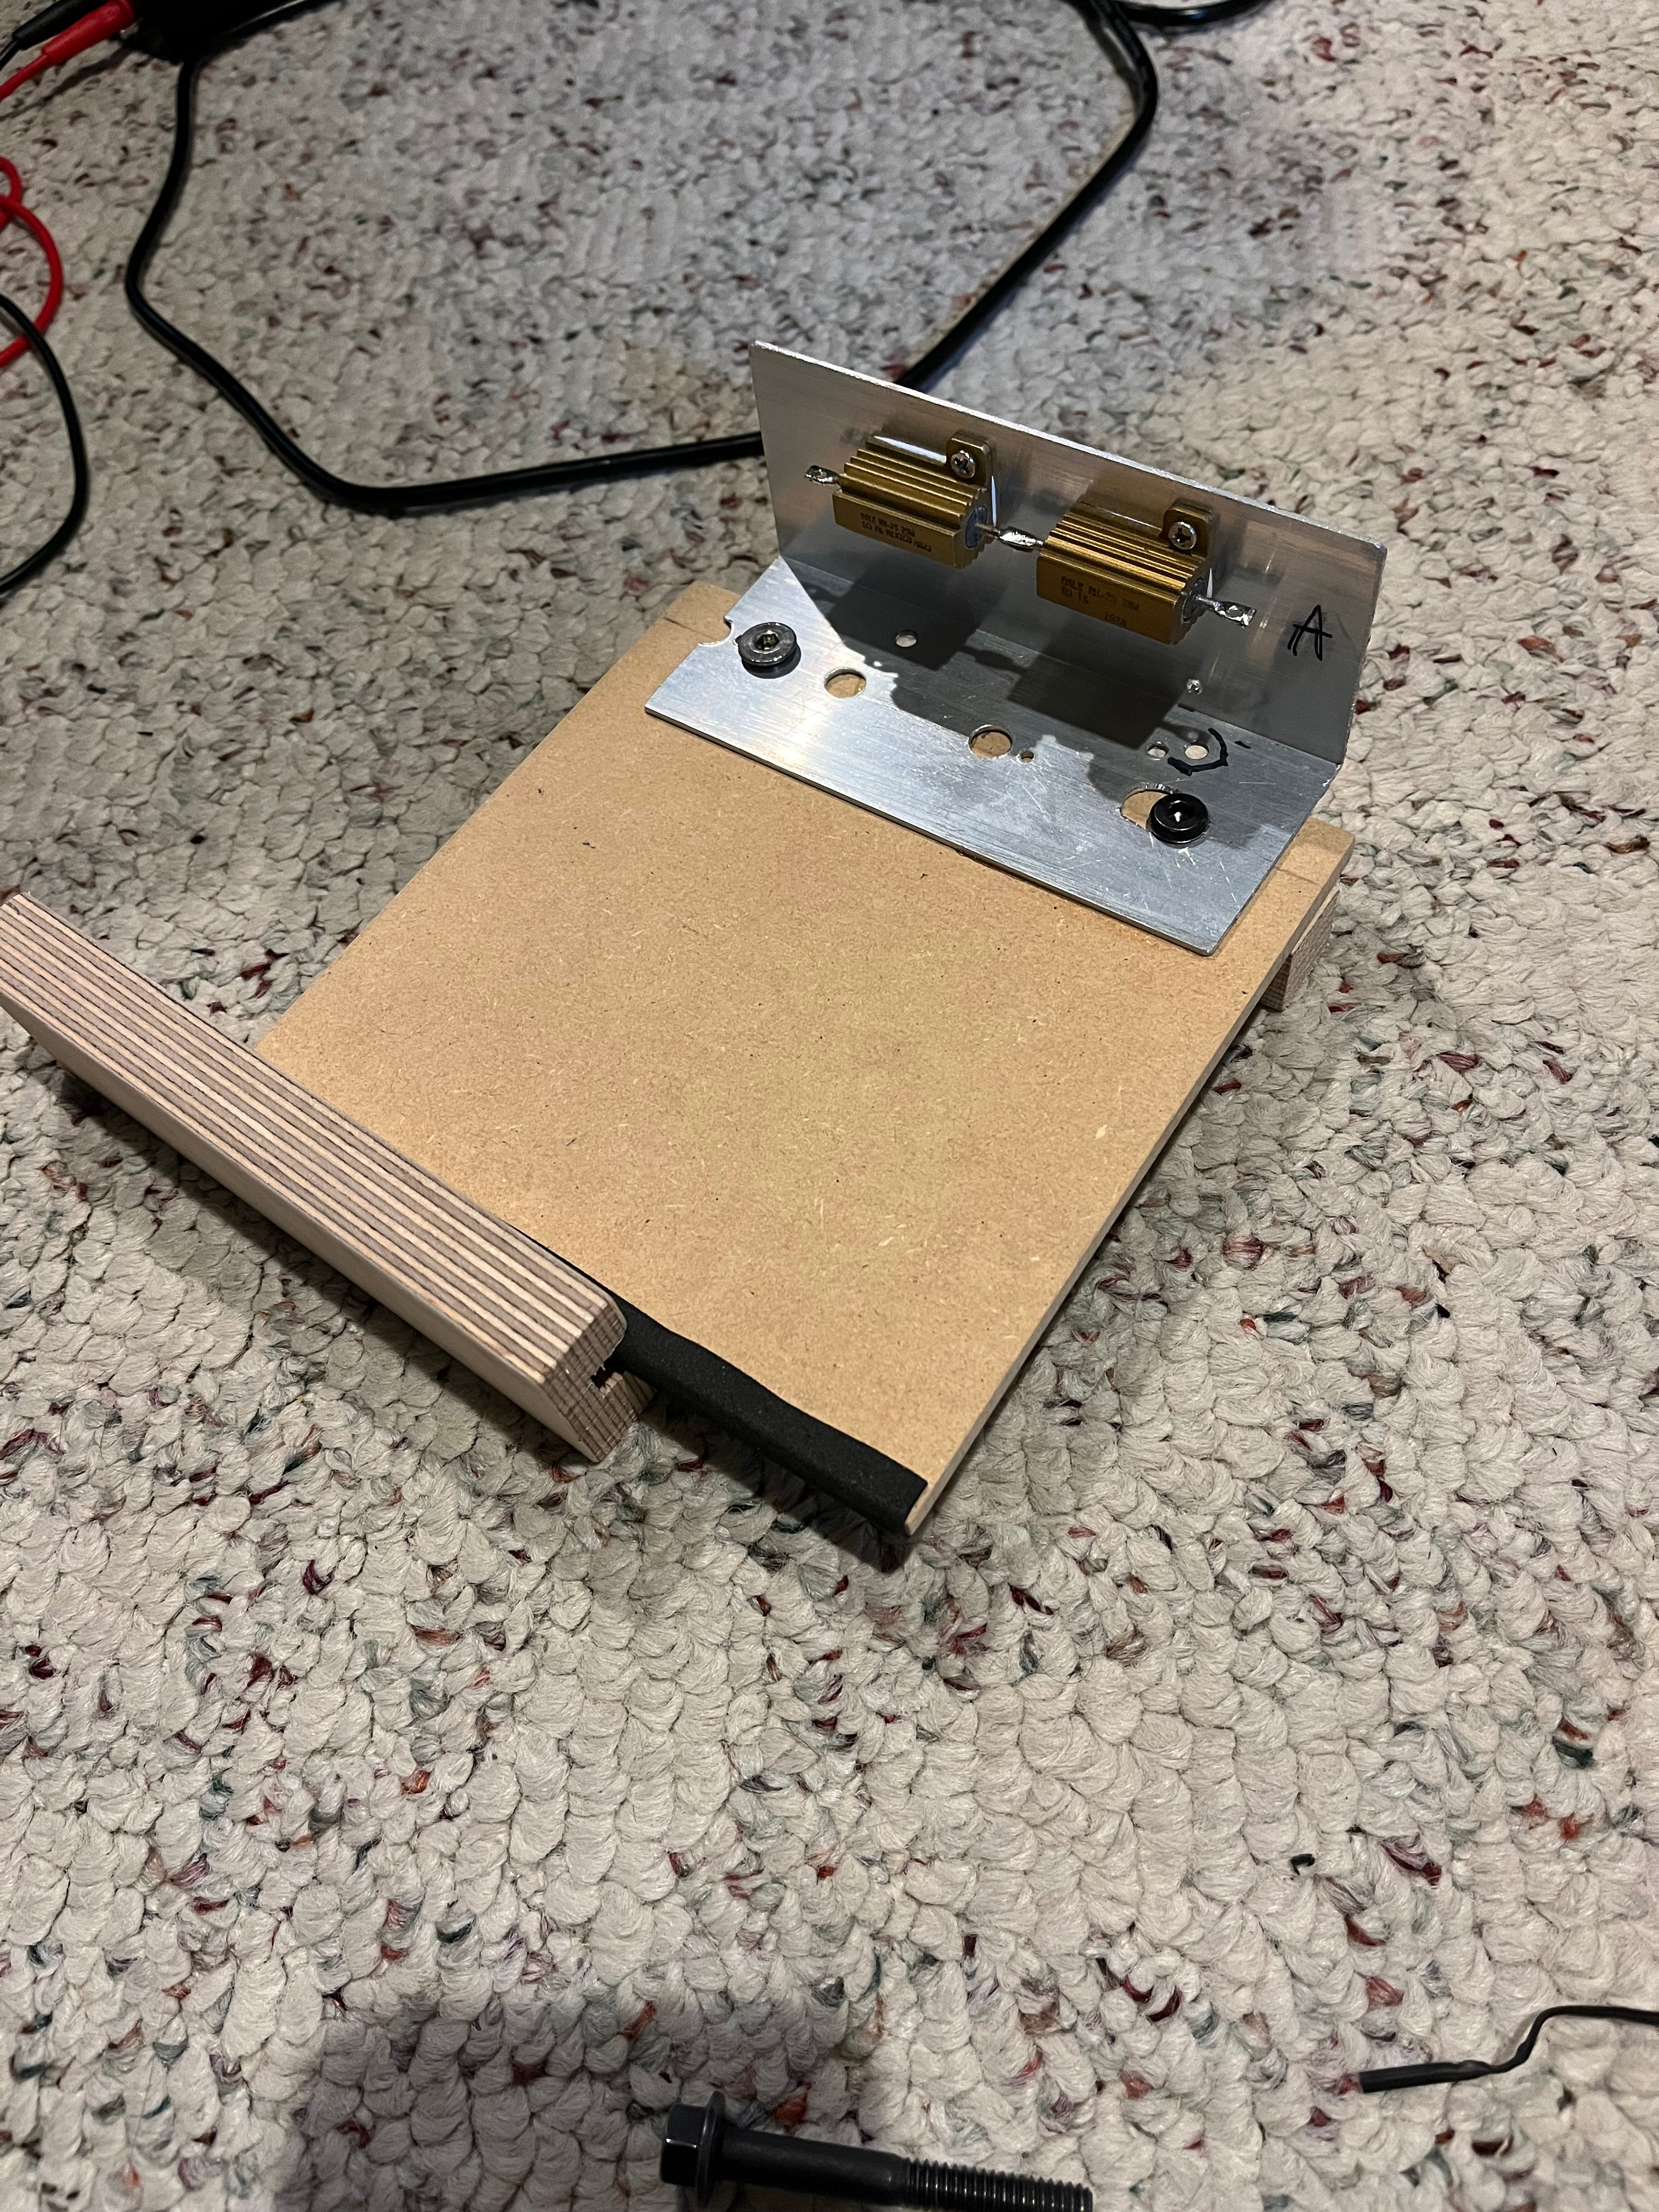
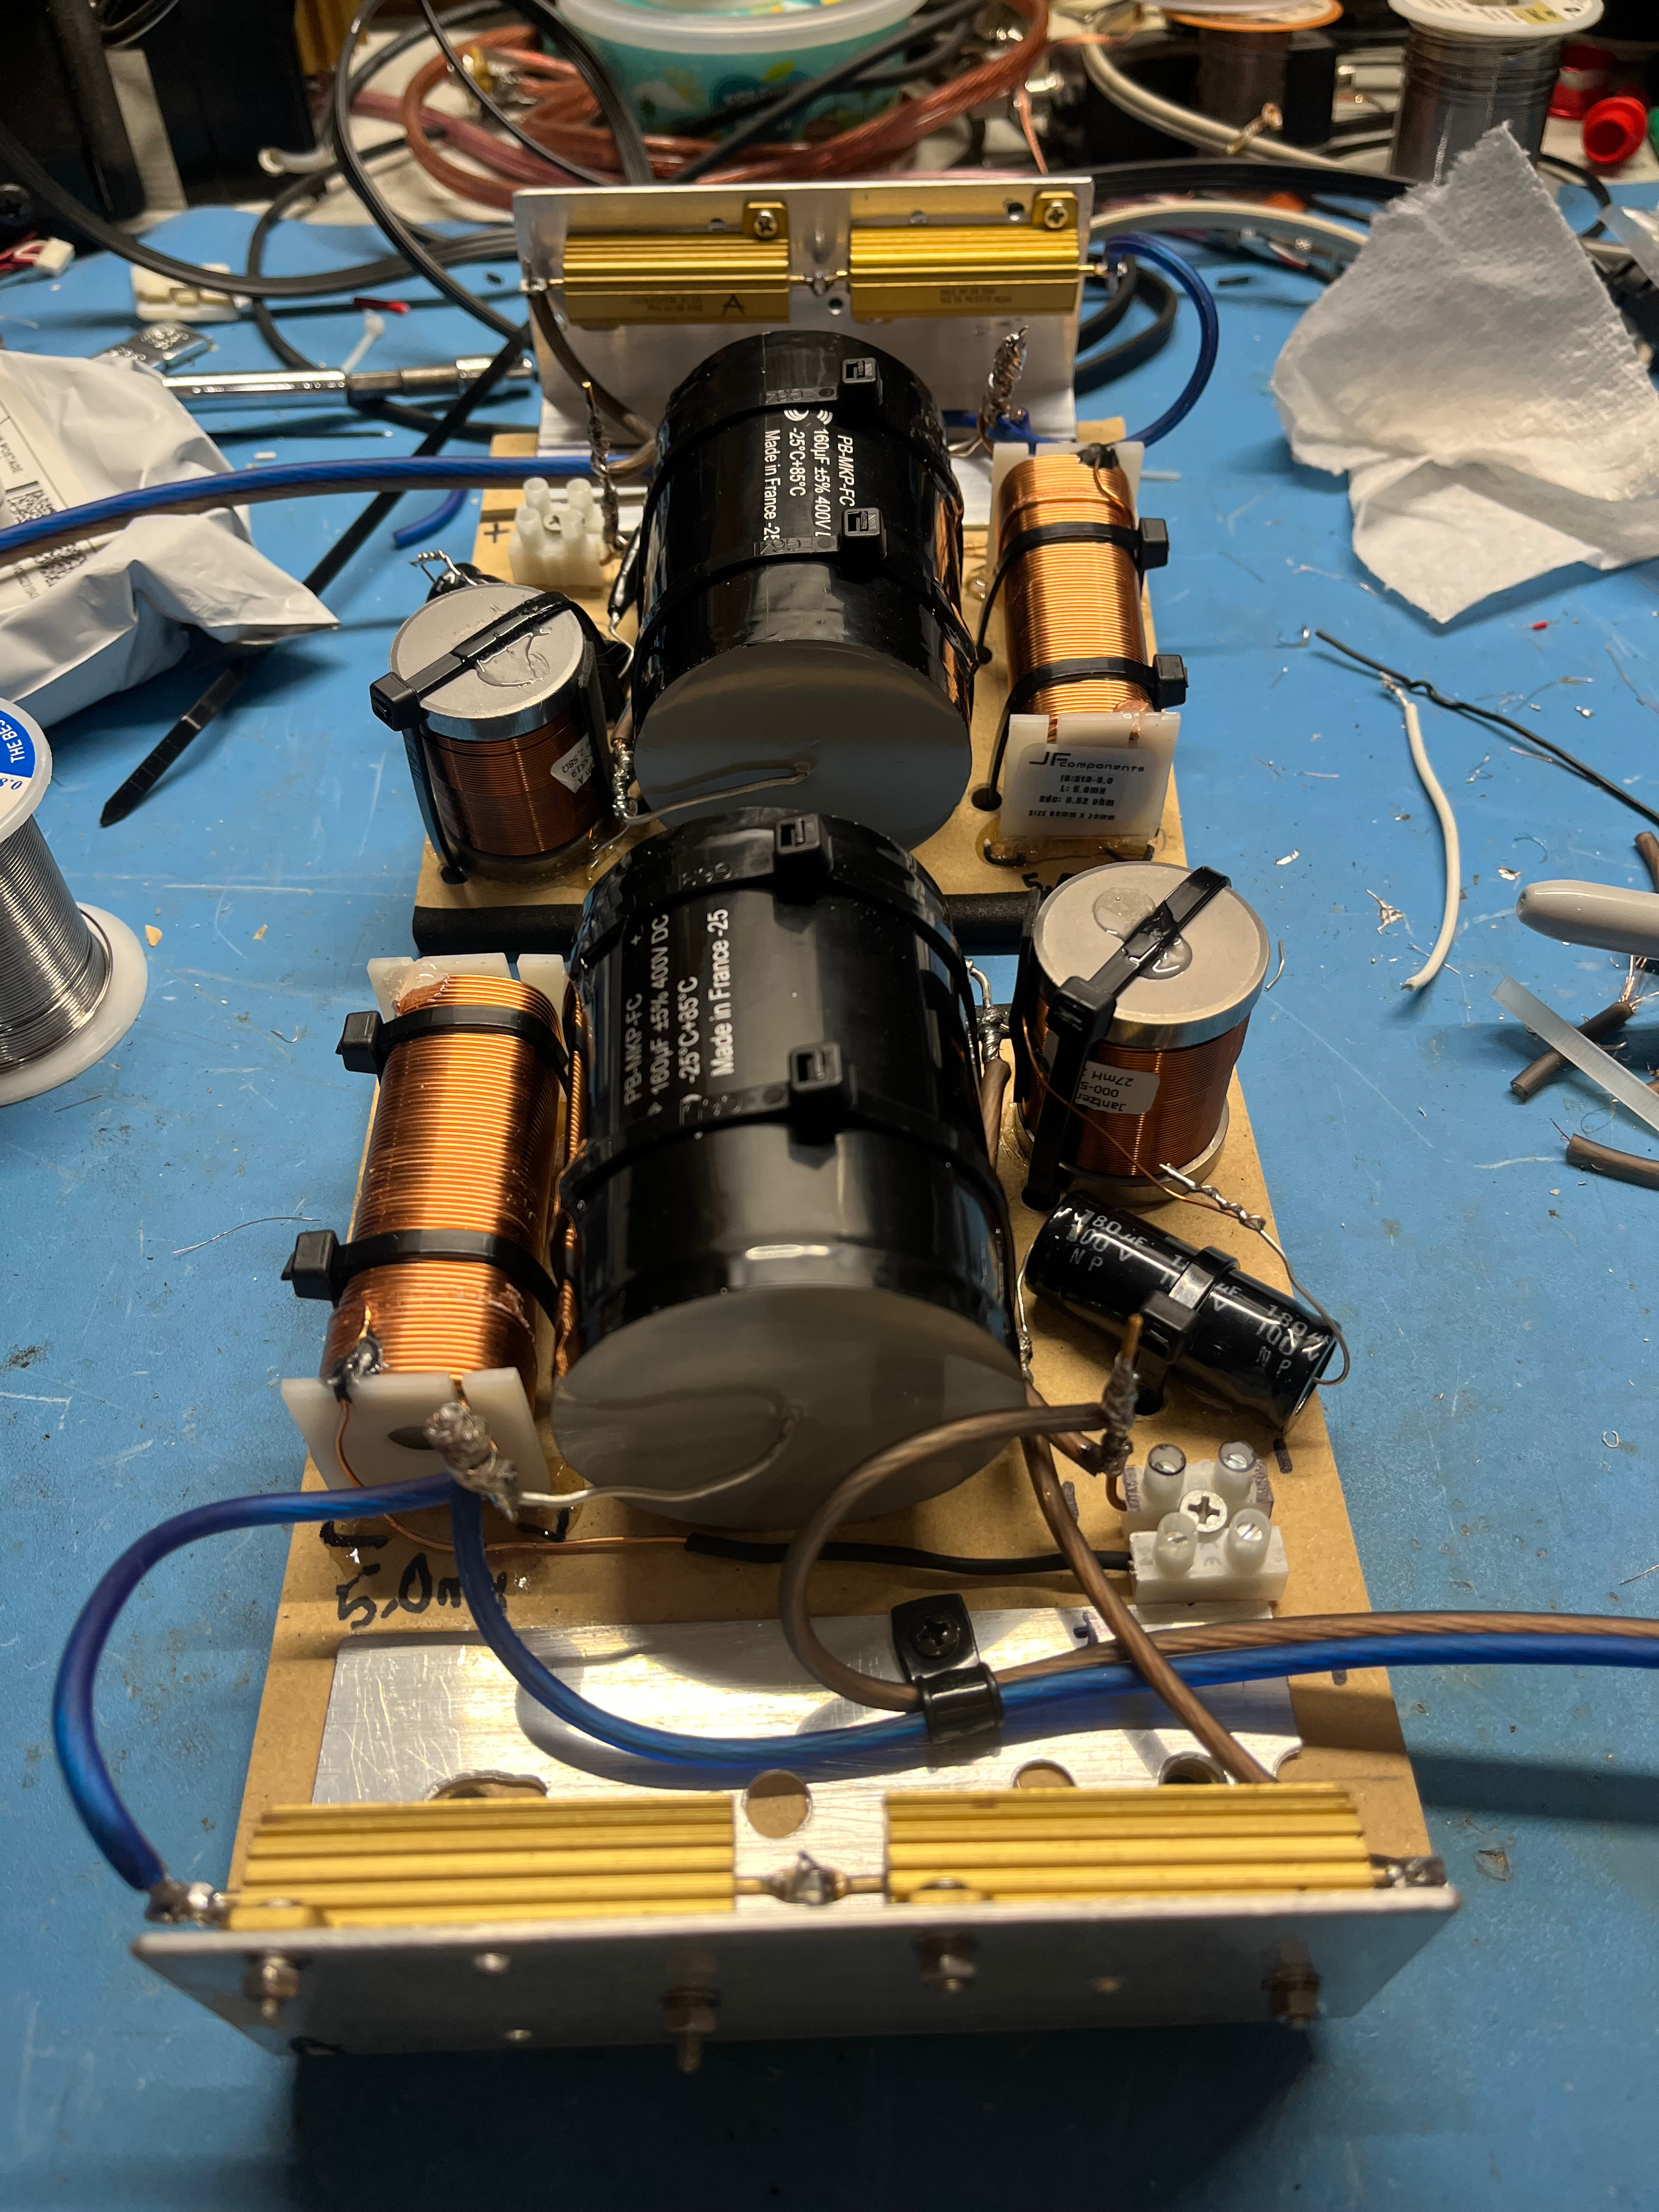
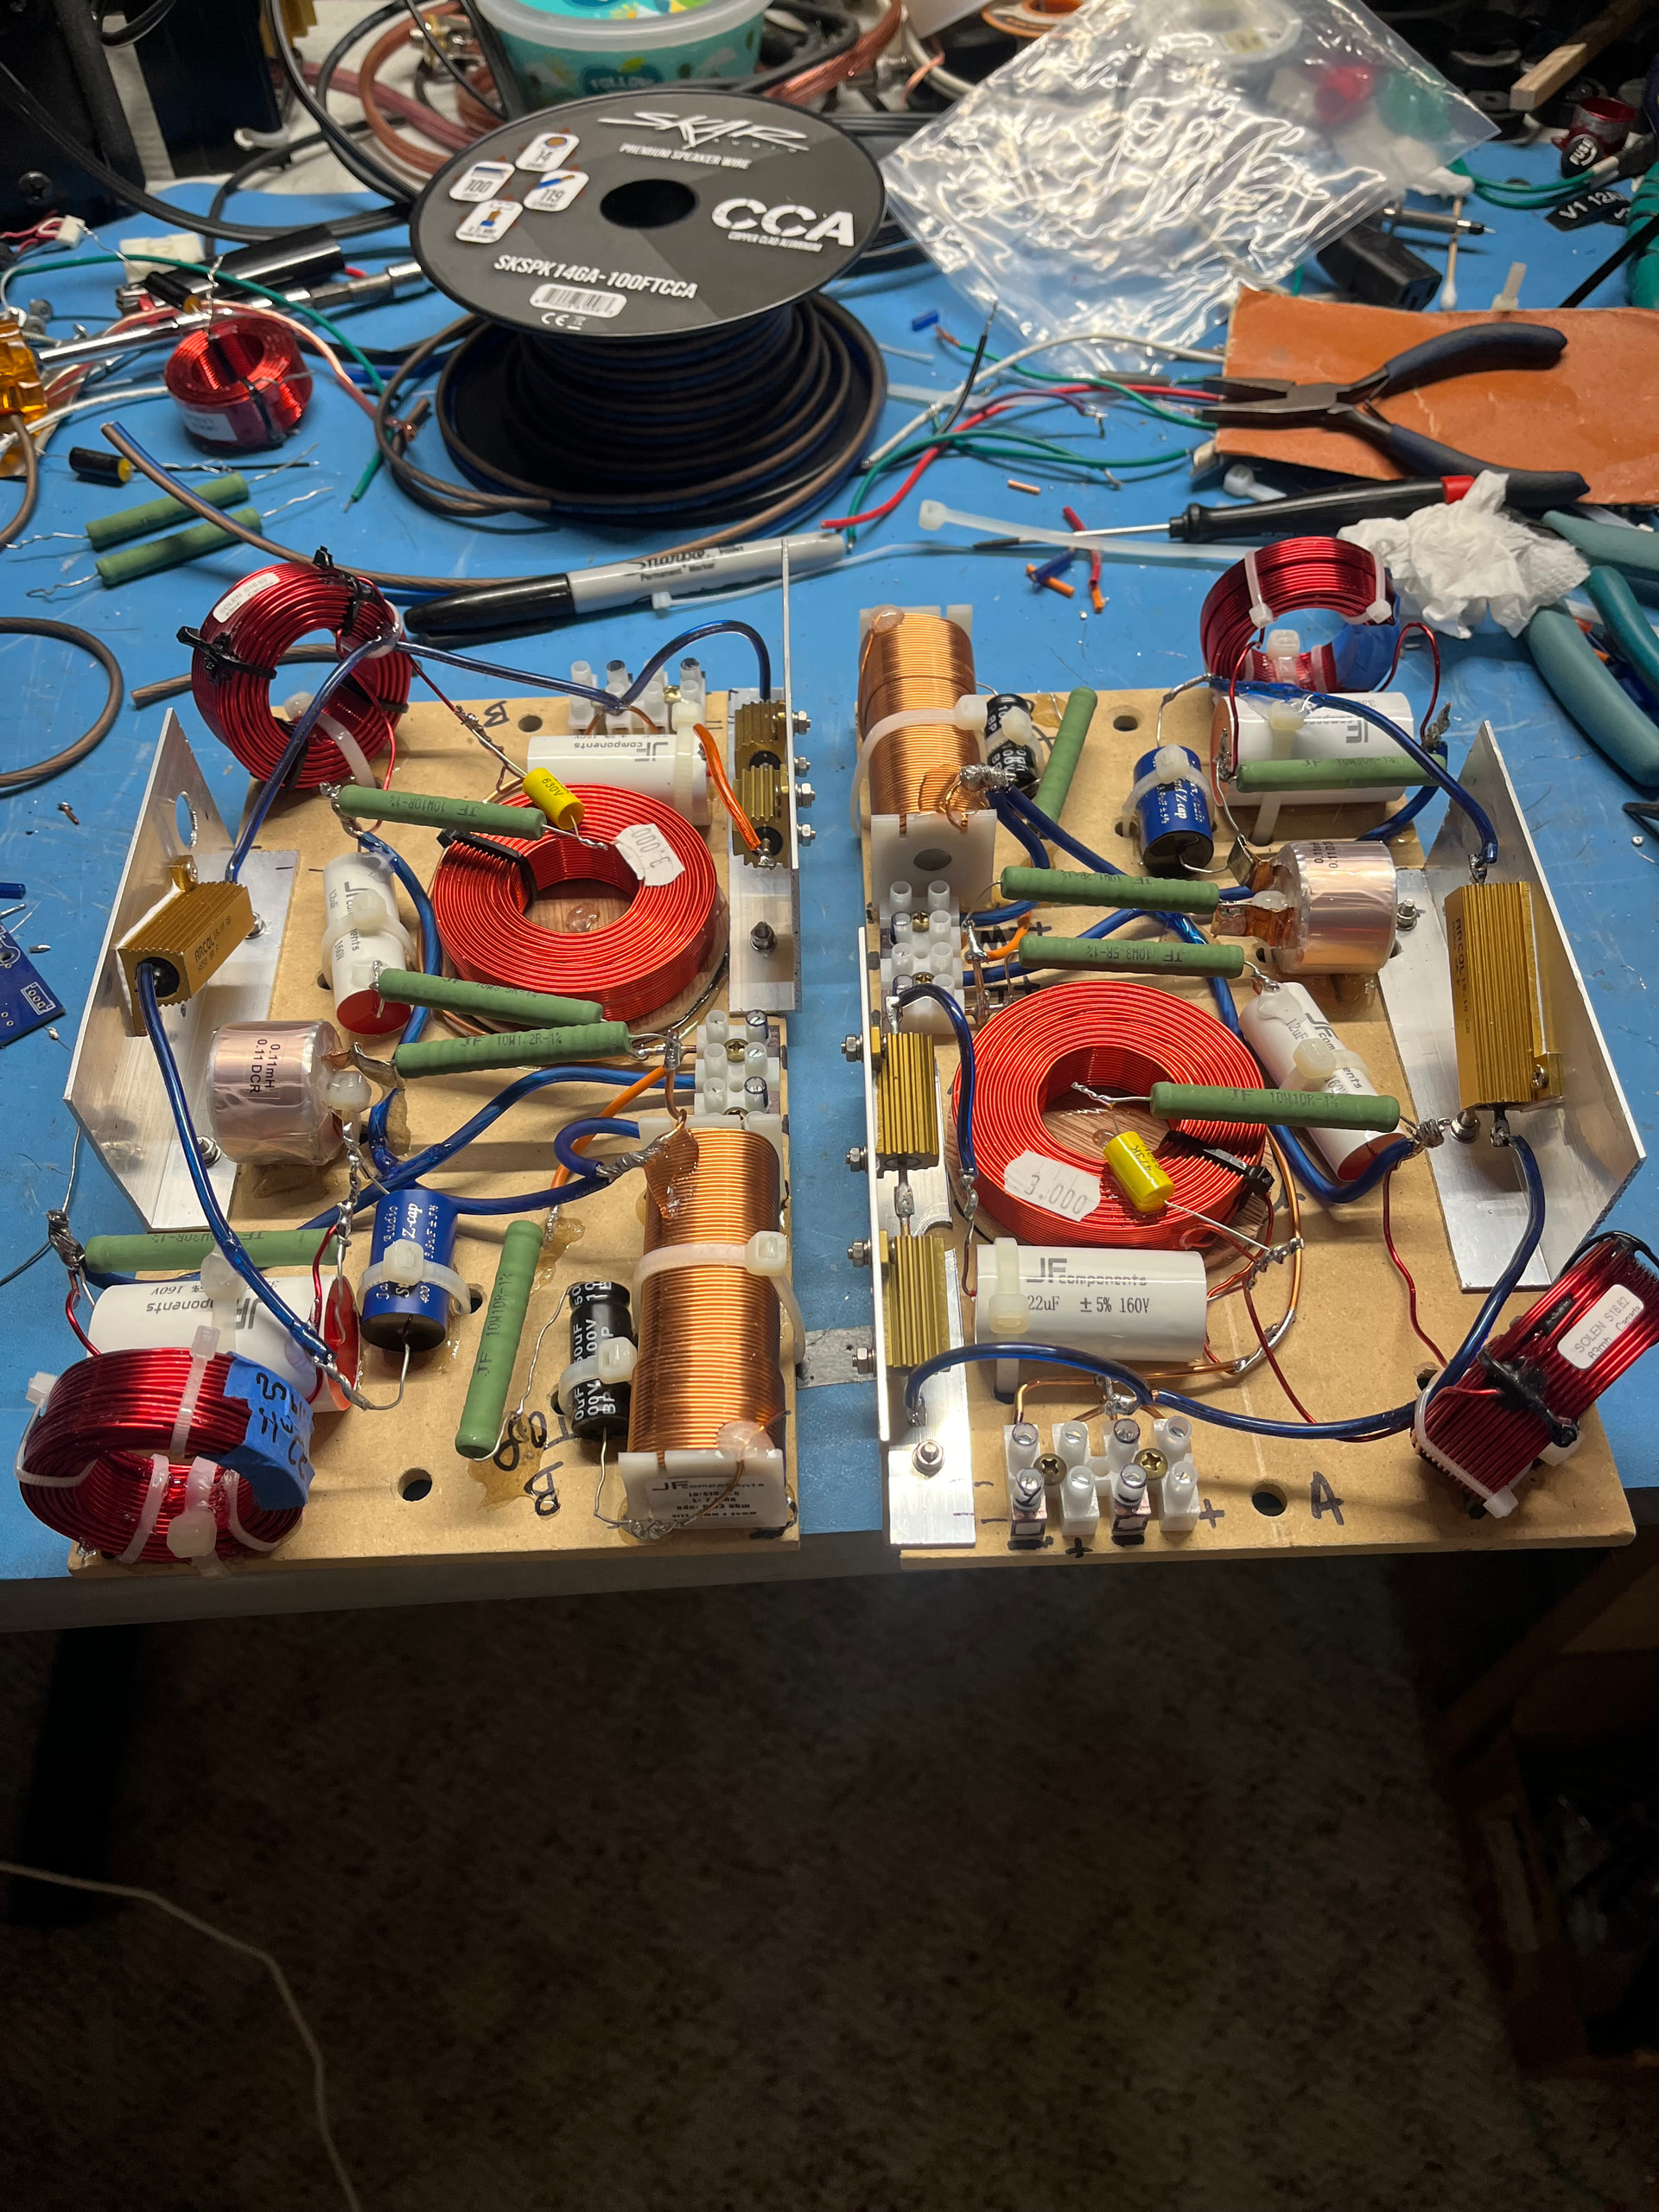
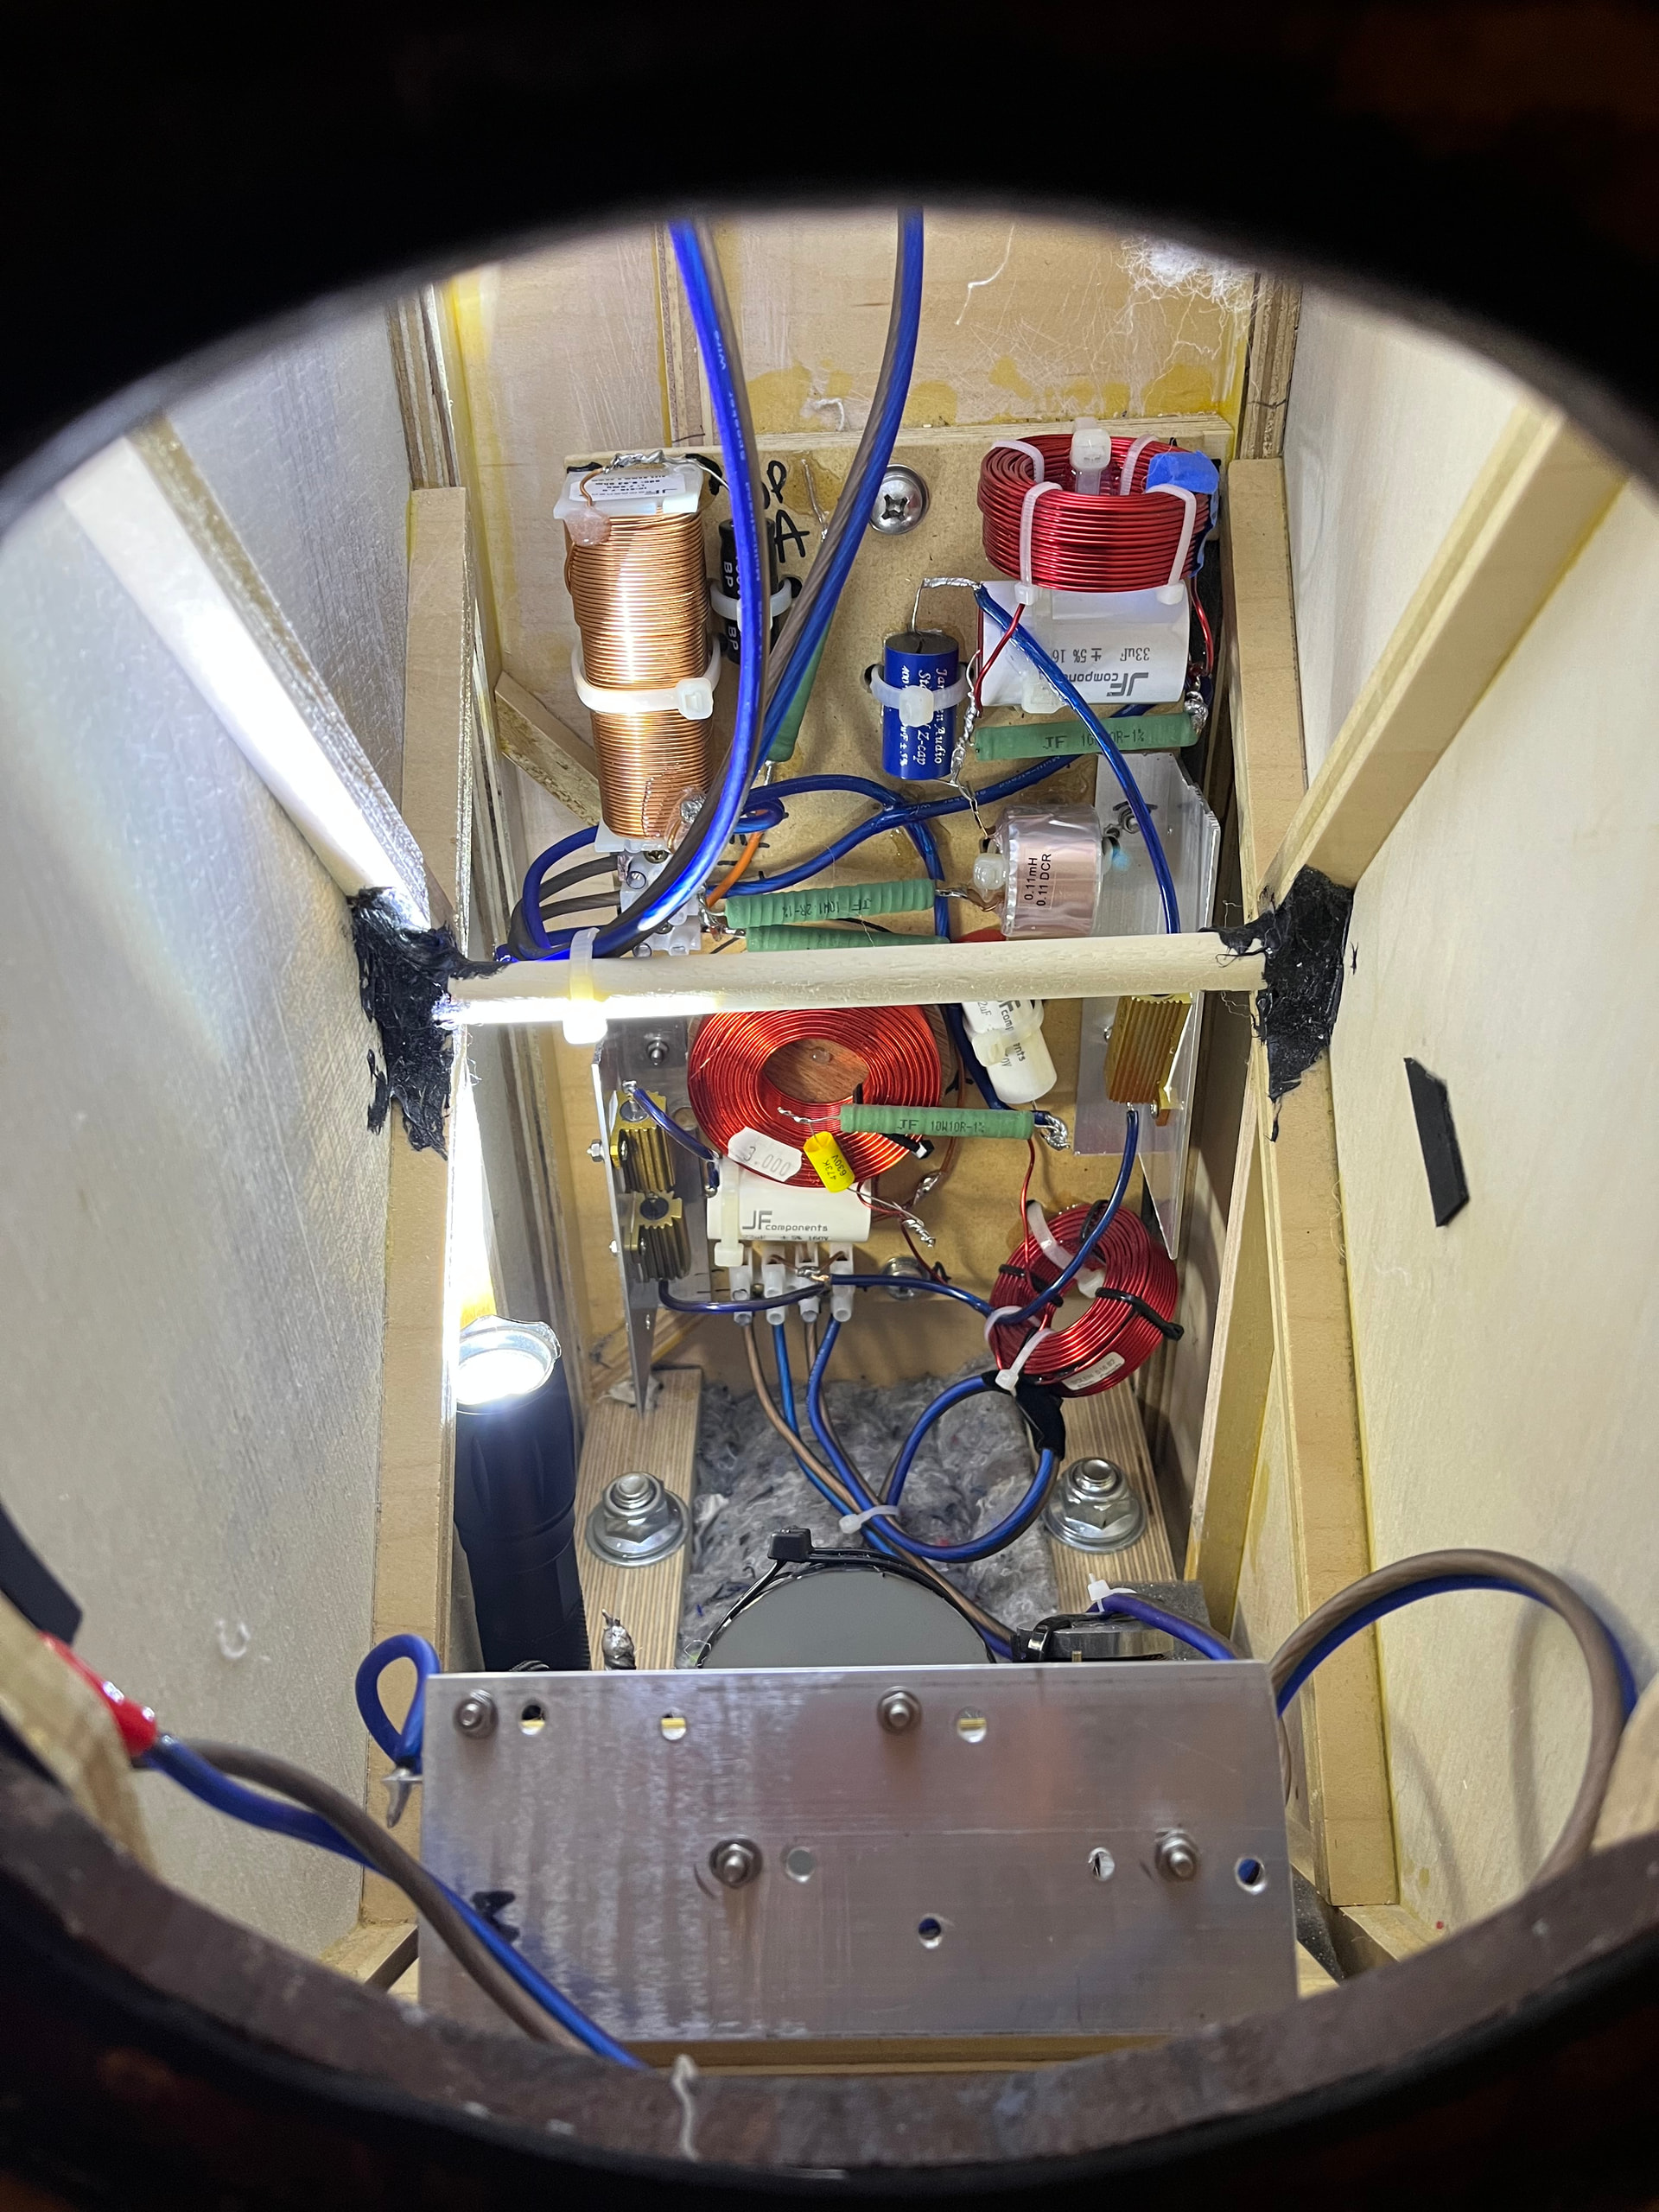
Well I was overly optimistic about getting all the xover parts on the one board. After analysing the situation, I decided to add another xover board for the woofer parts.
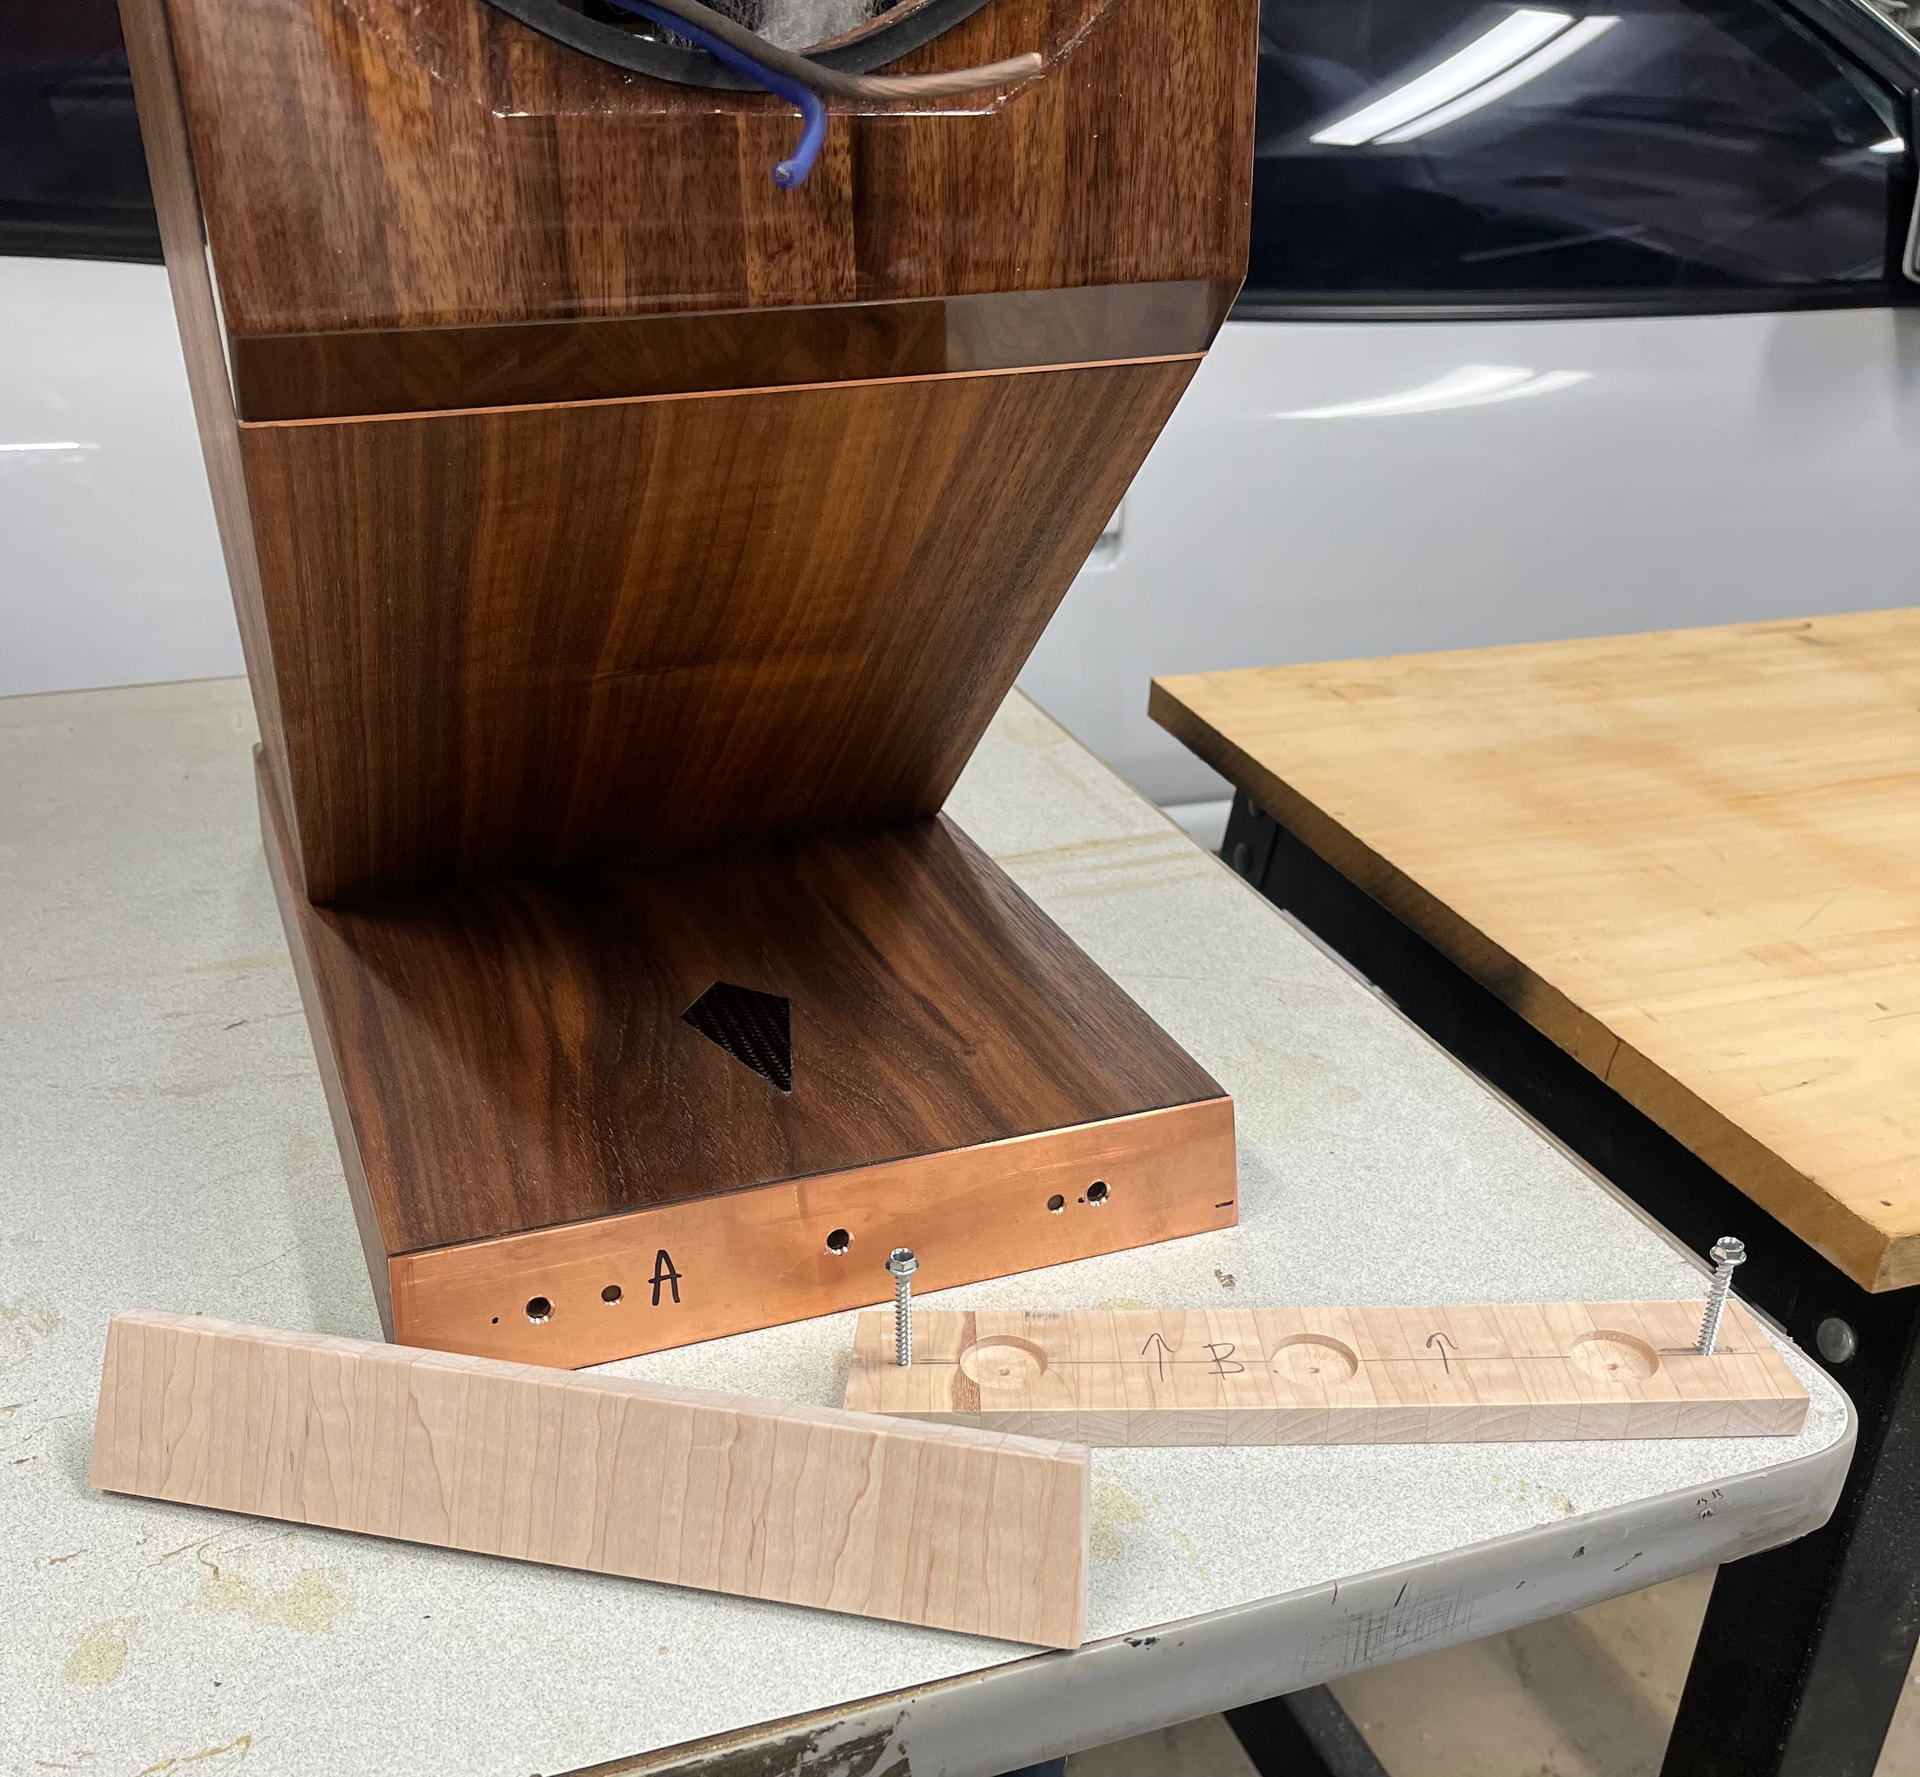
Built a couple boards with heatsinks and did the ol bolt the boards to the mounts and glue in place trick. Once dried I’ll remove and install all the junk that goes on it.
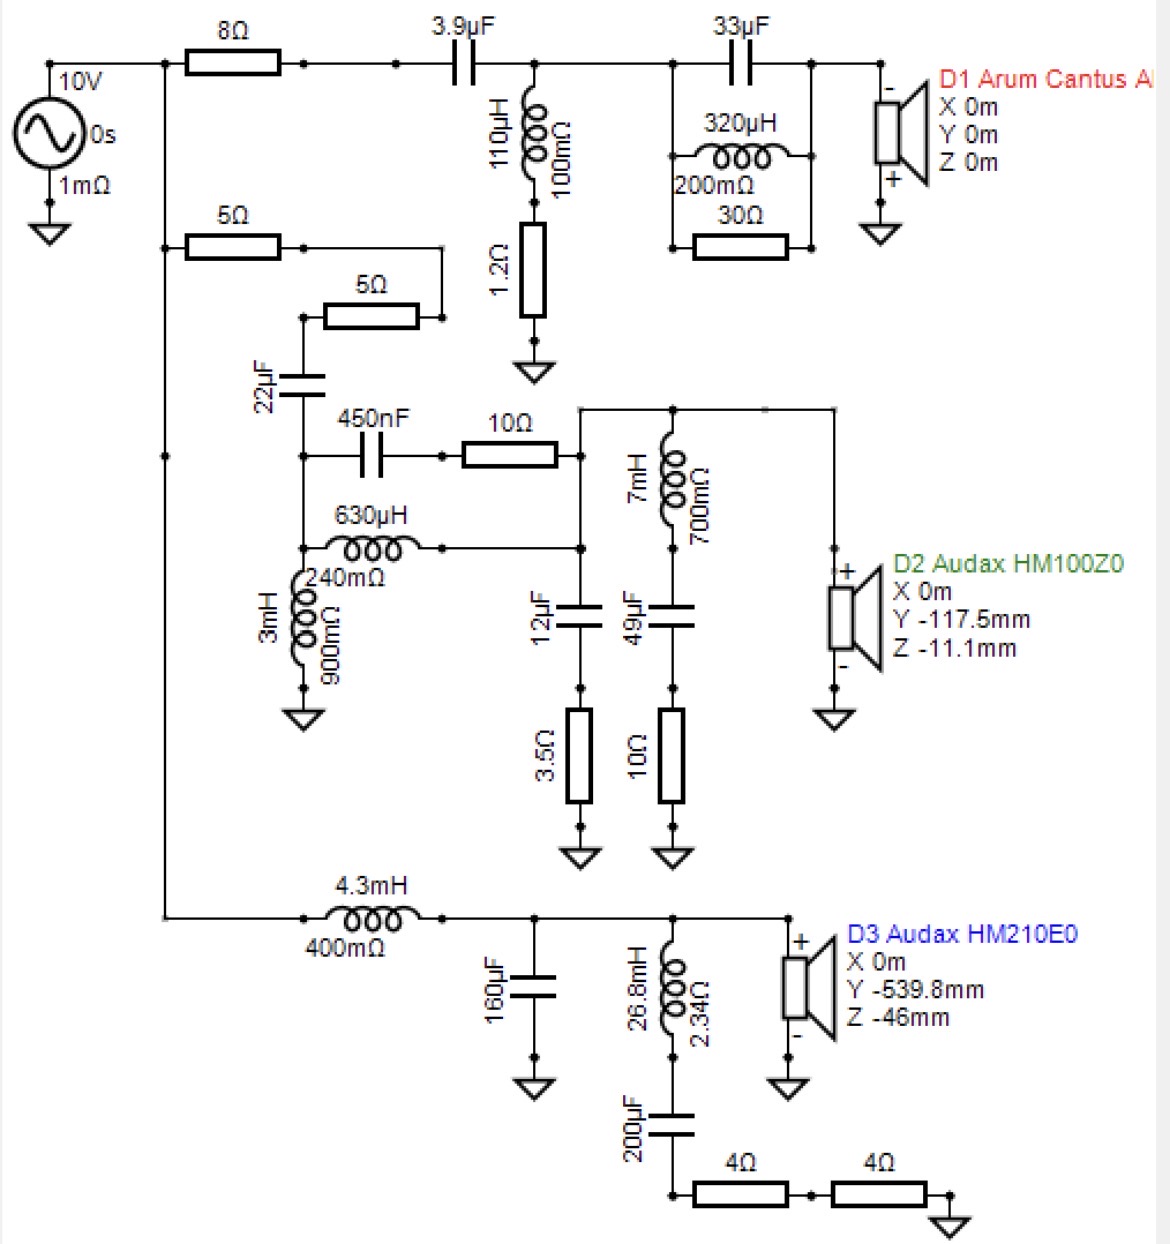
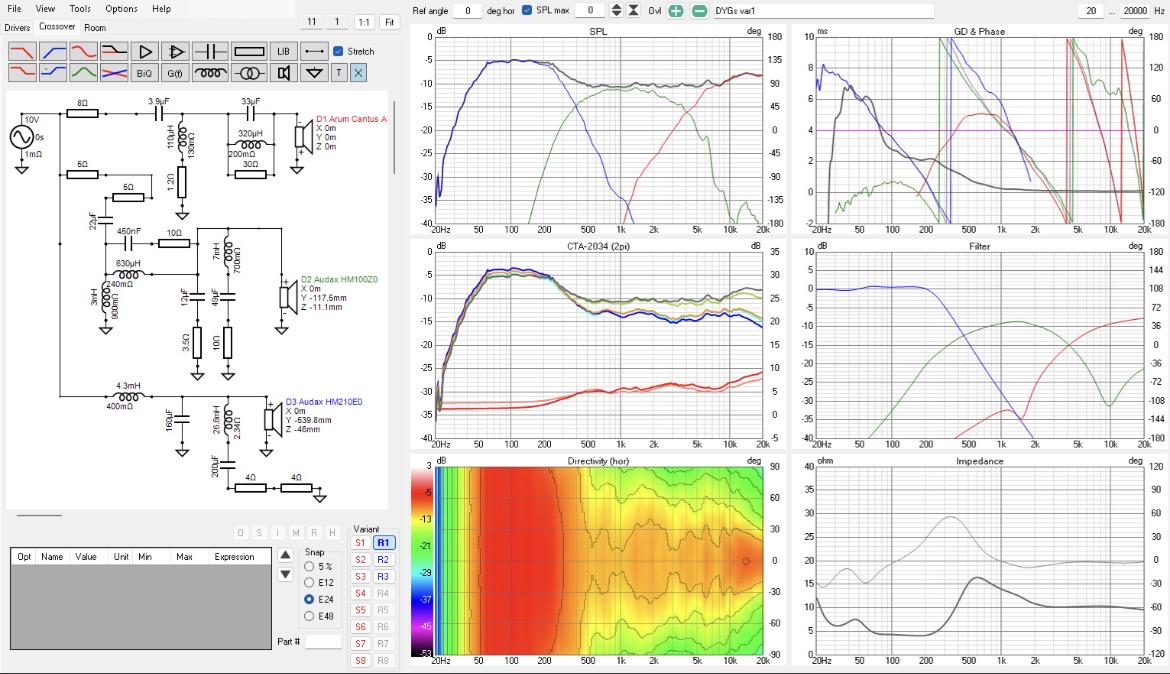
Originally I had a 6dB HP on the mid, that required notching the Fs. I later switch to 12dB and raised the xover point. Probably could have ditched it, but it kept everything smooth down there. Tank on the LP coil for some minor break up control.
Last is the big notch on the woofer. When passively LPing a woofer you get some peaking of the overall response. You also get a drop in impedance. That 26.8 (27mH) / 200uF notch smooths out that peak and raises the impedance. I was really surprised how much more fluent the low end sounded after implementing that notch. I picked that up from that PK Audio guy over on the DIYAudio board.
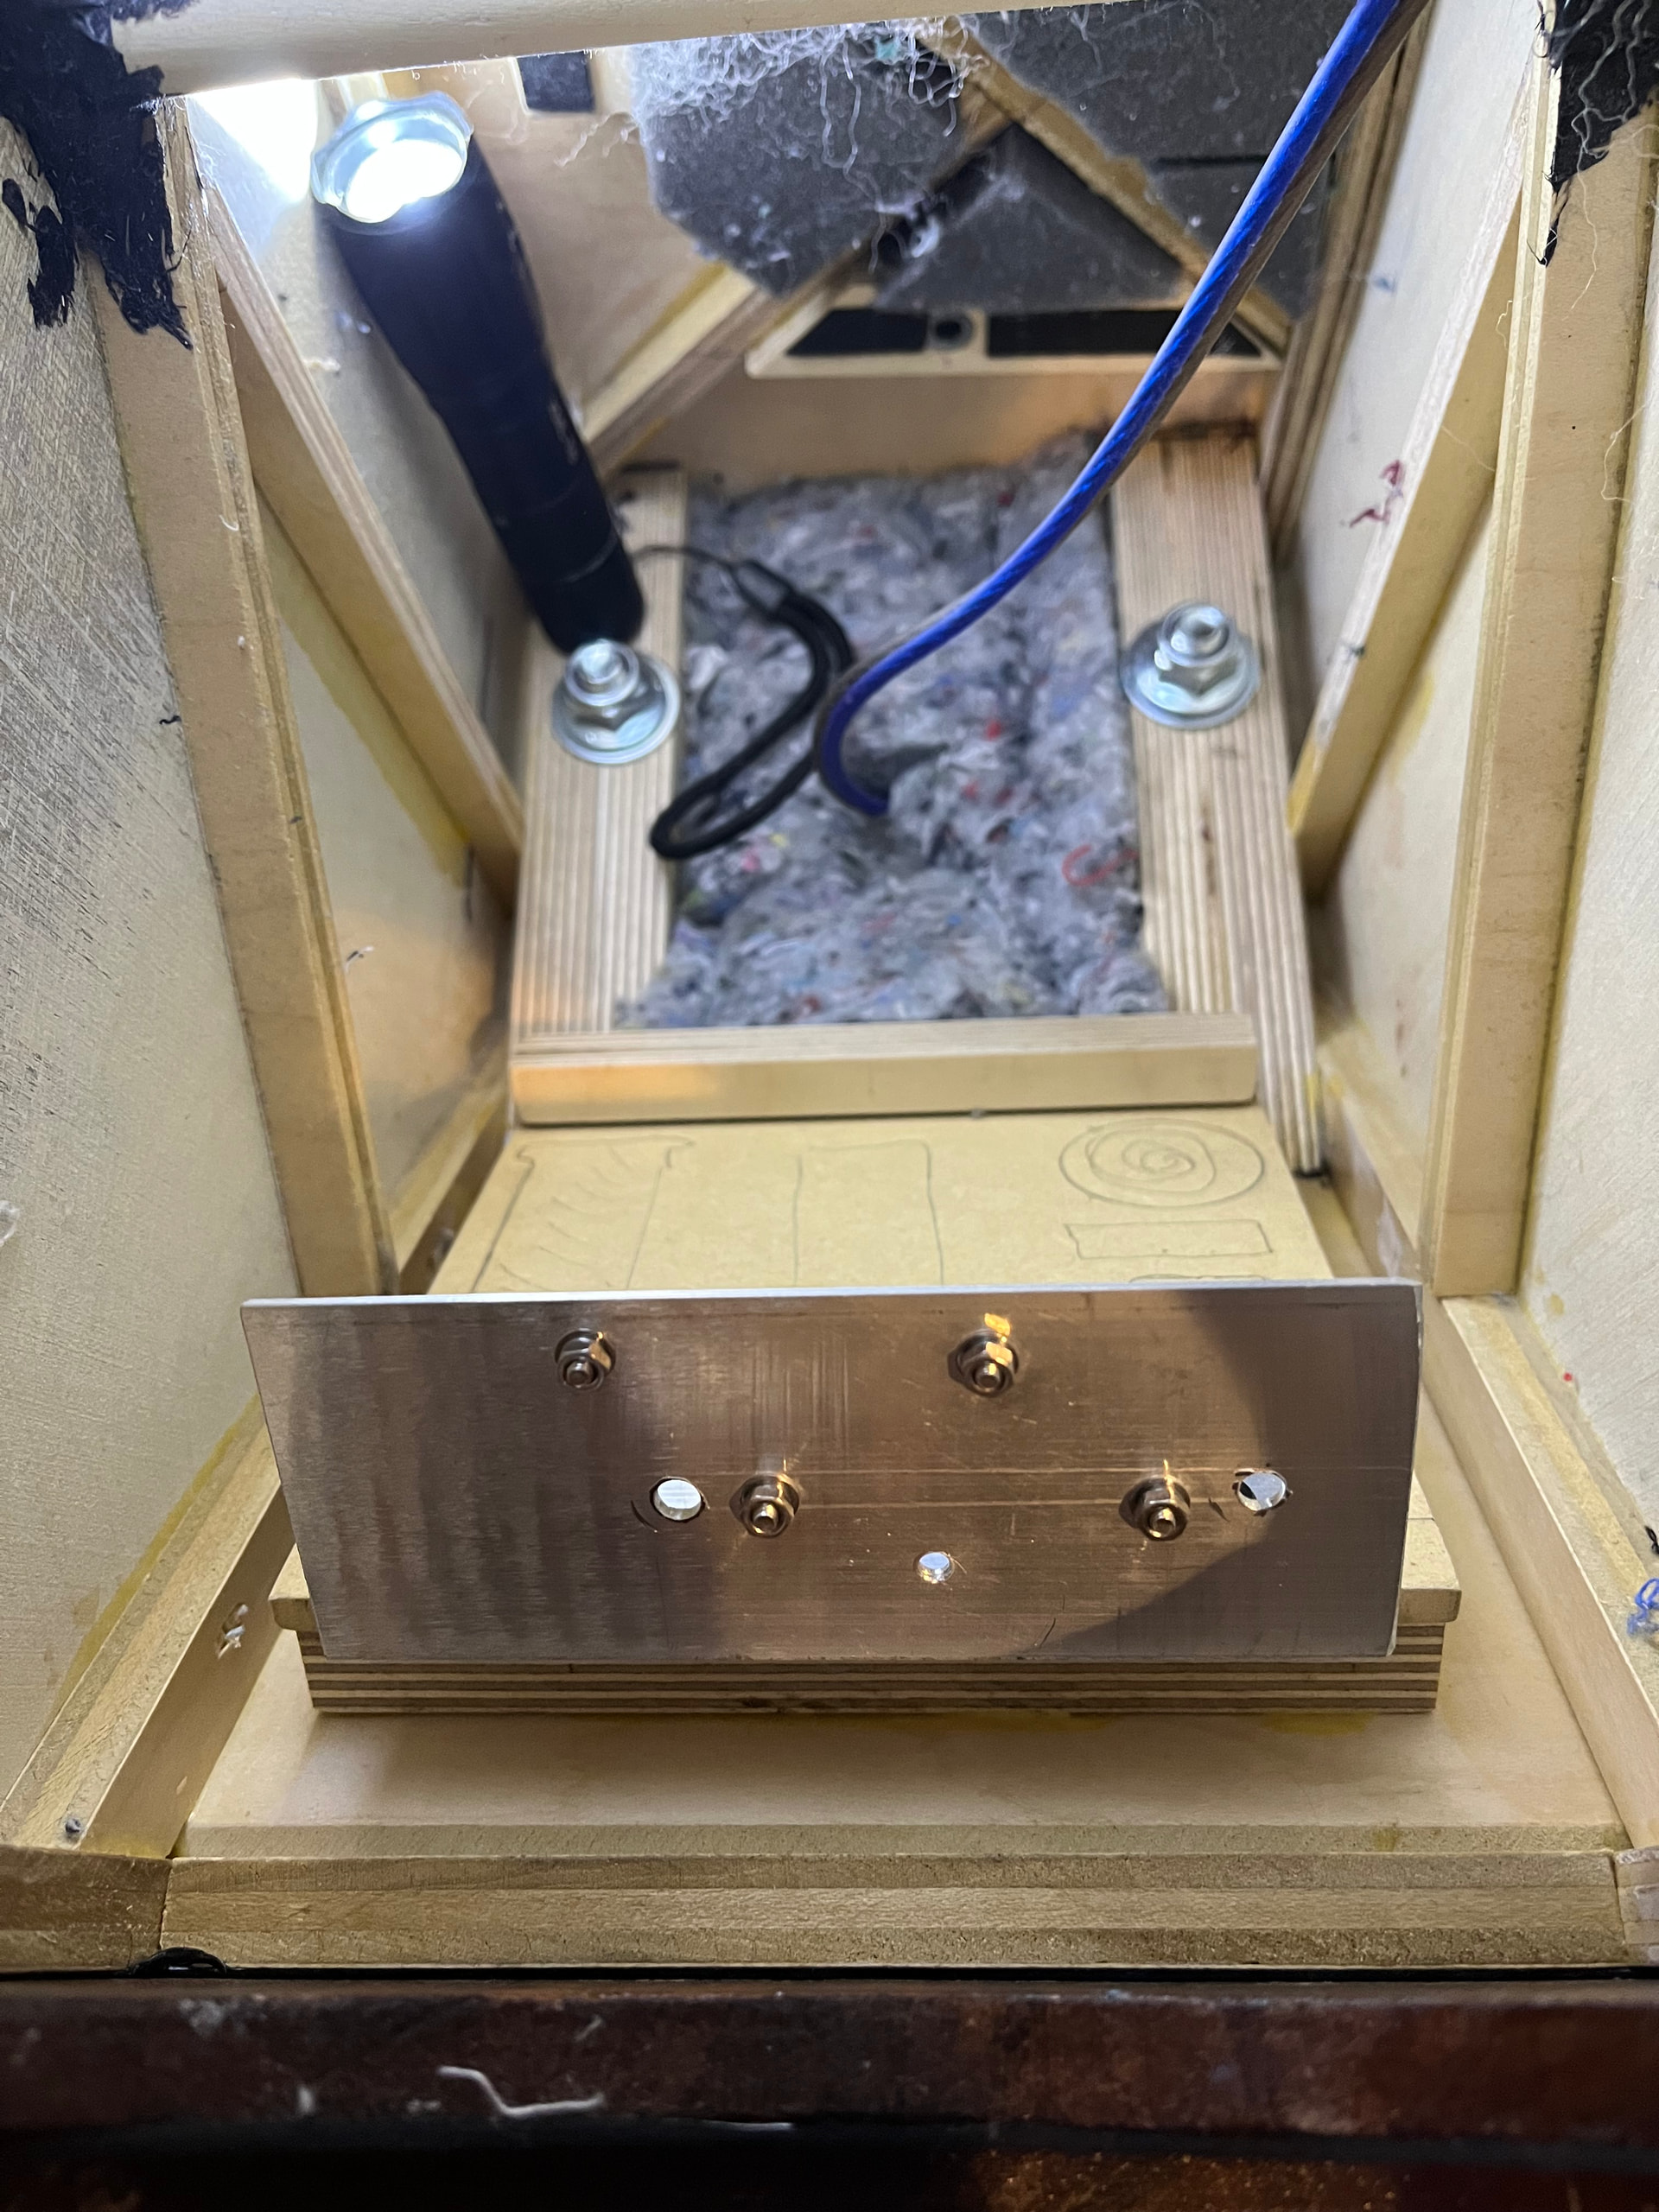
Working on the front base trim. First iteration no worky. Gluing copper to wood is NOT a good idea… thermal expansion. So copper piece separately glued on with the urethane sealant. The maple piece will be off for clear, then also glued on with said sealant.
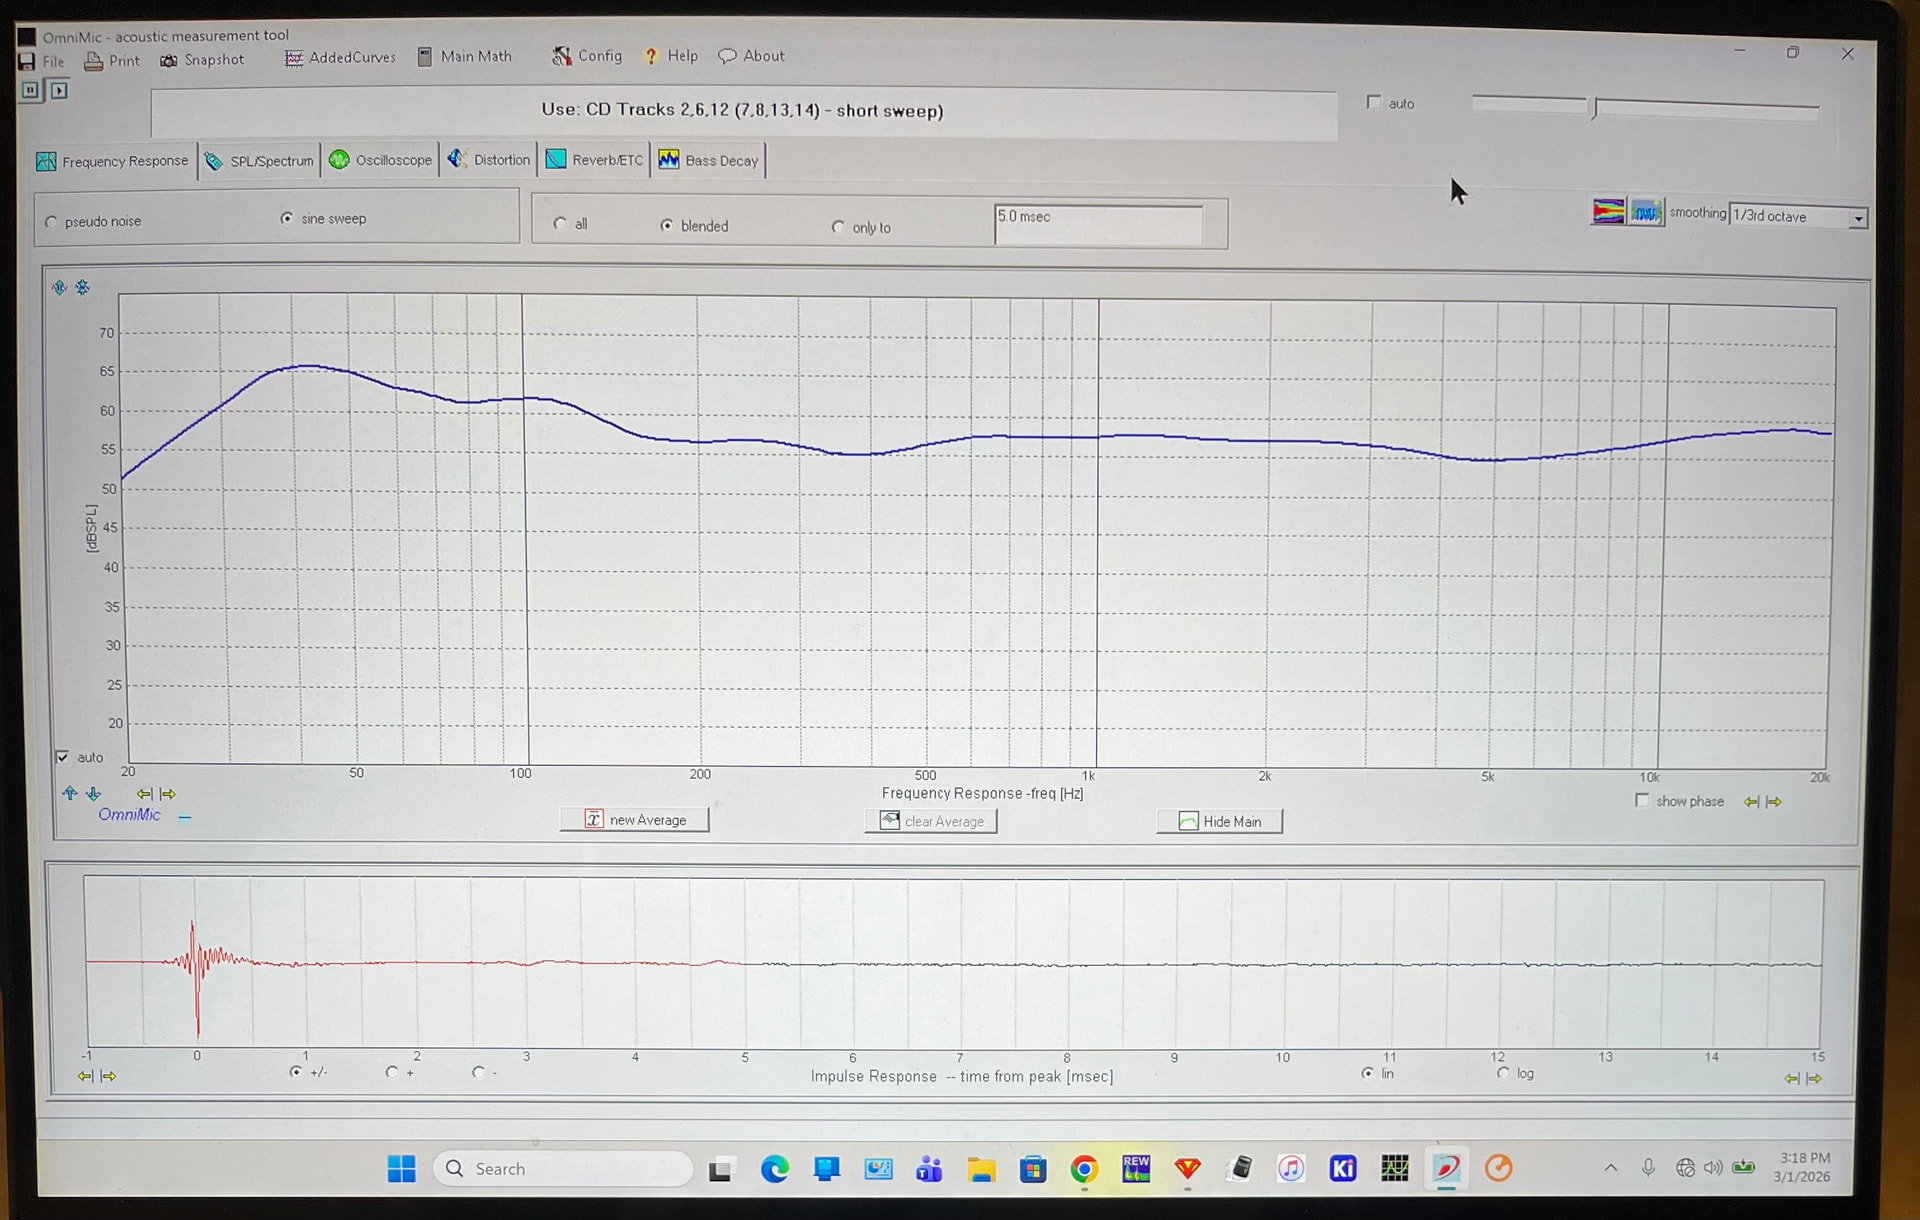
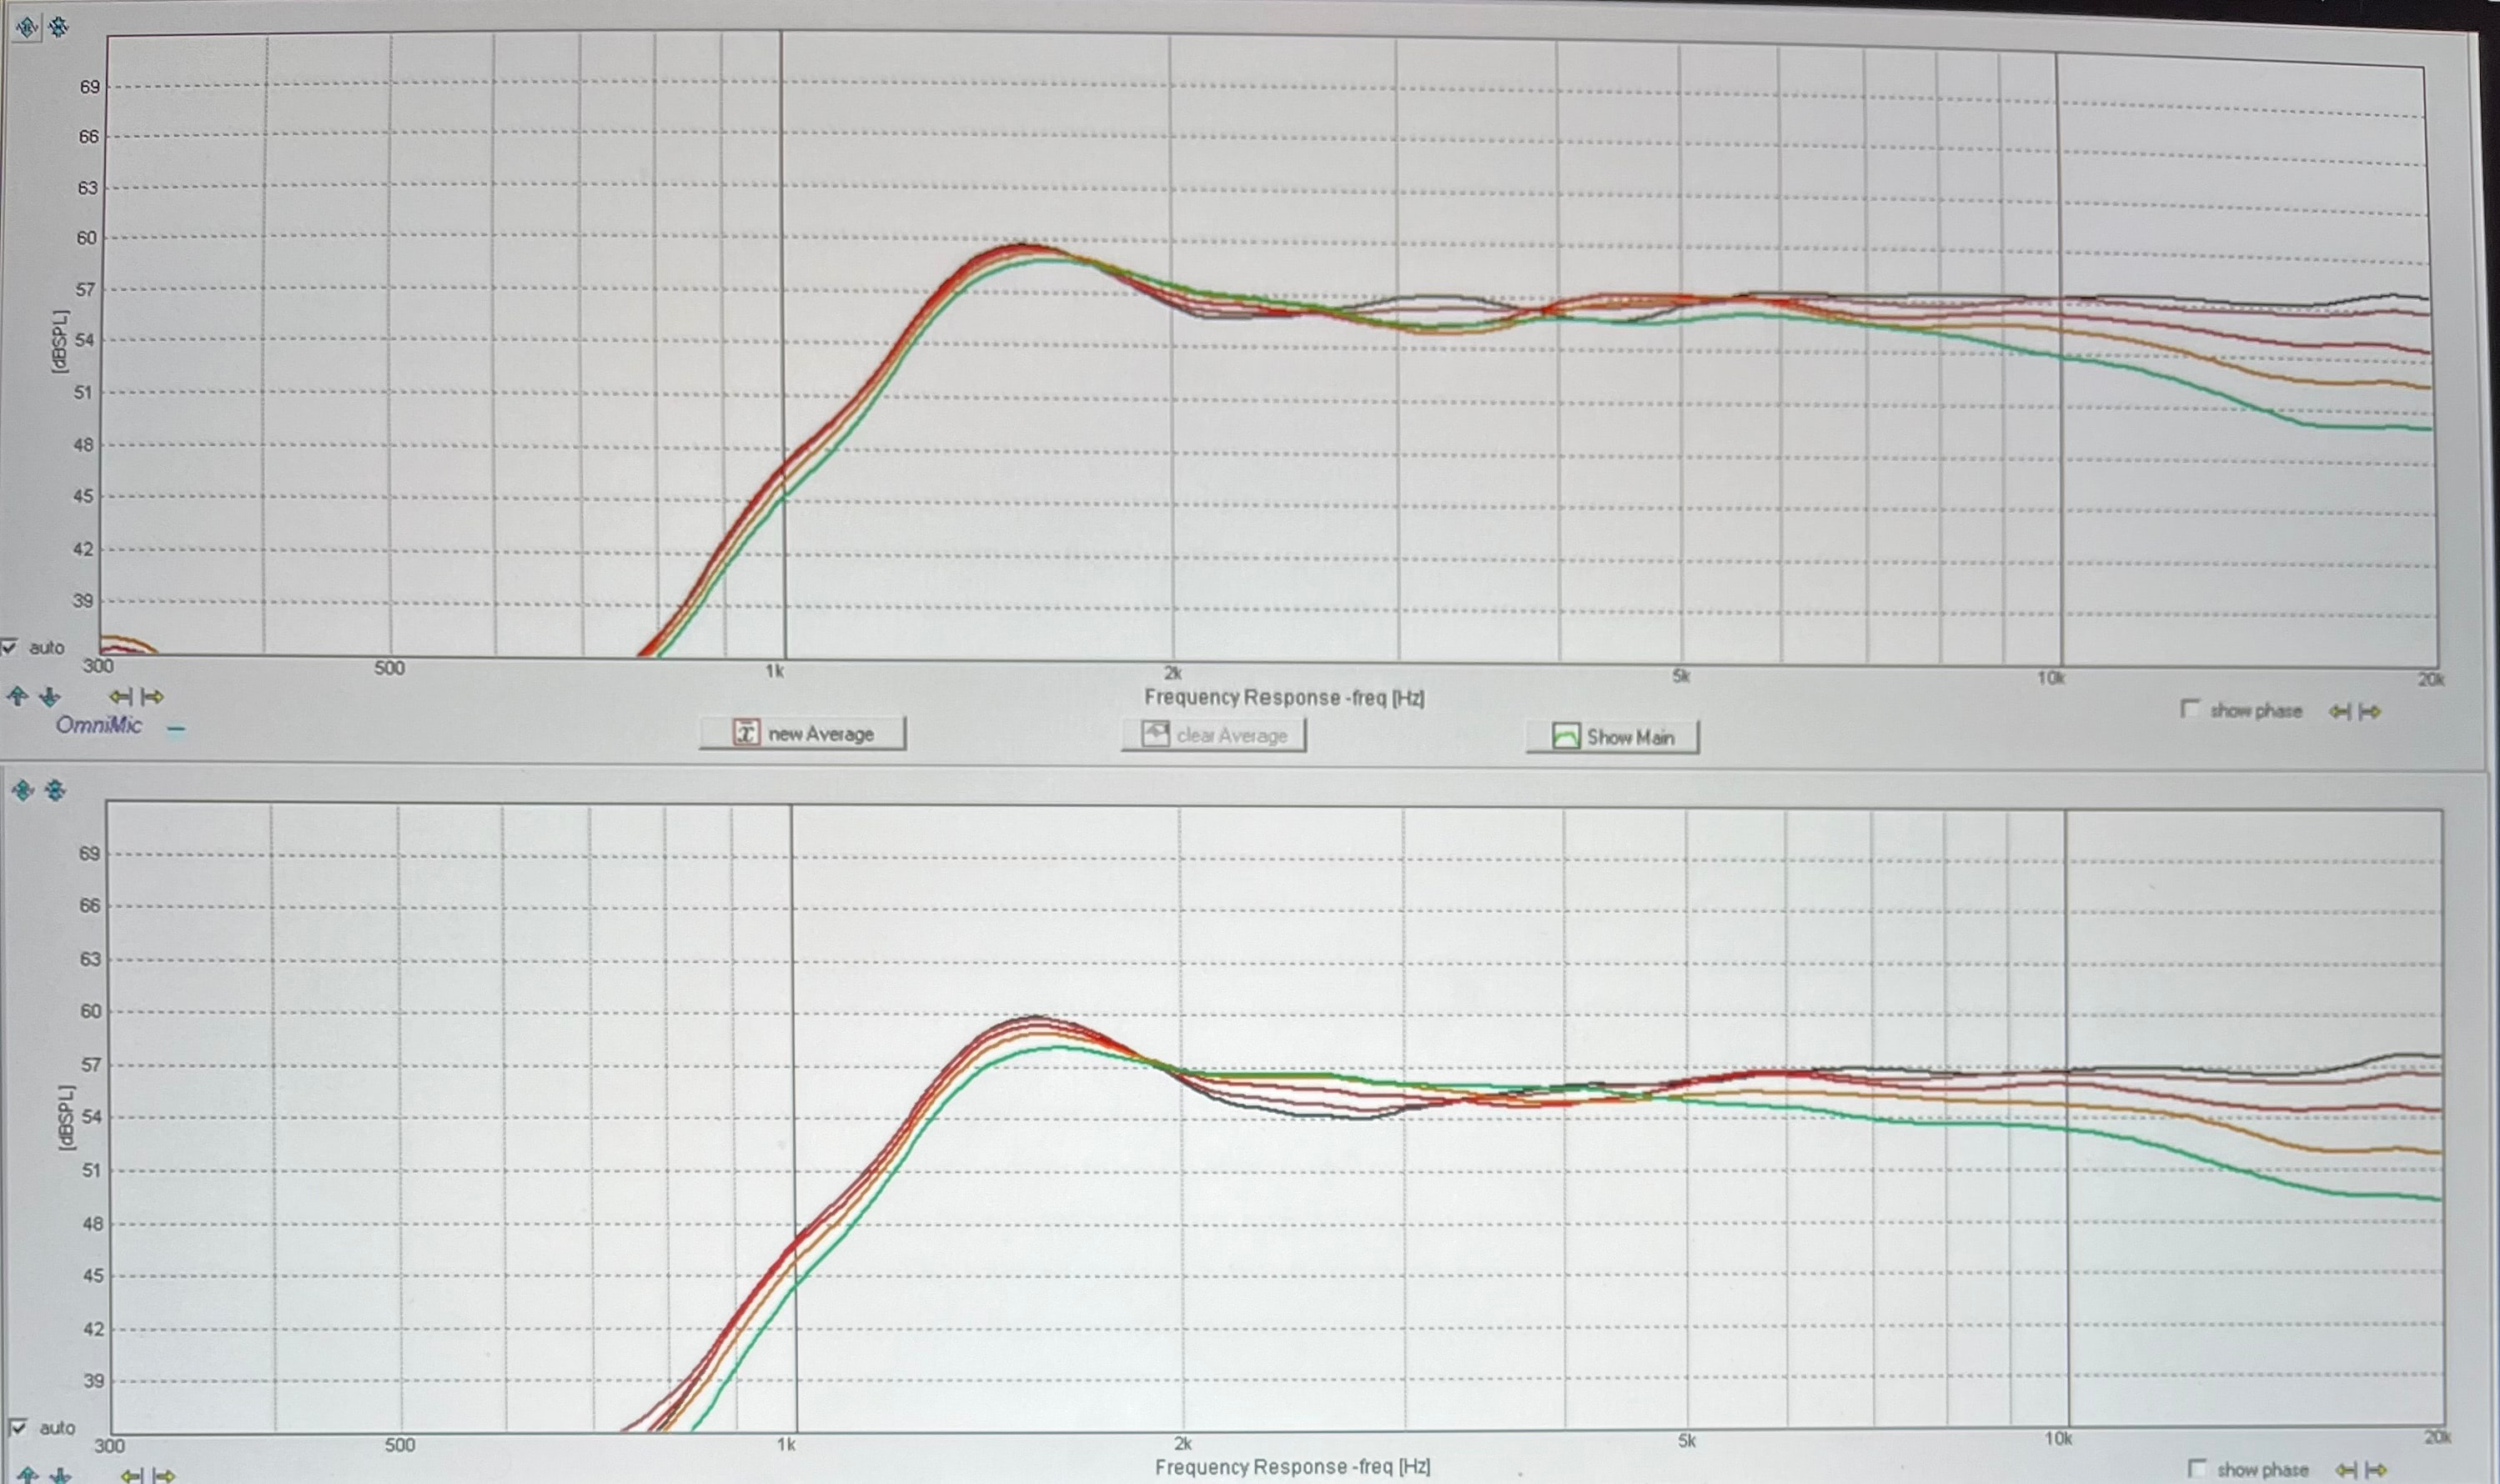
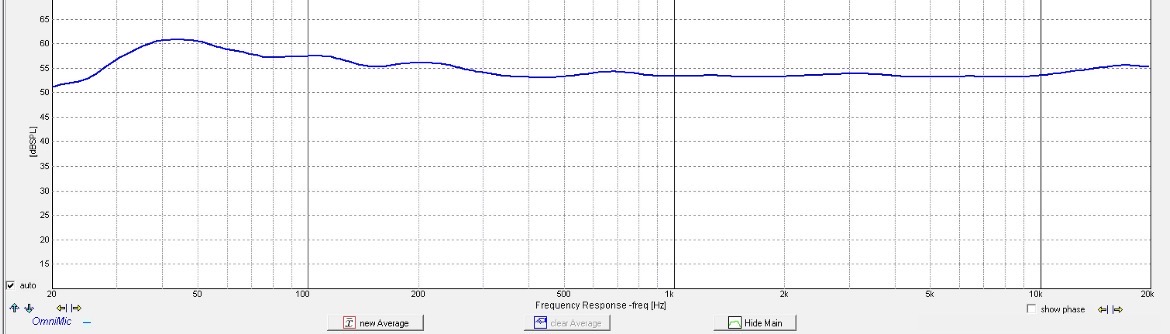
The bass hump looks so much worse in that little graph compared to what it measures in OmniMics full screen.
Really digging this project, probably the best mids I’ve heard out of my builds. The bass is deep and tight thanks to Paul K and RJs help with the box modeling…and stv’s vent. The top end is as good as it gets, ribbons just do it so well.
Should have the trim pieces for the bases done this weekend. Then some final beauty pics.