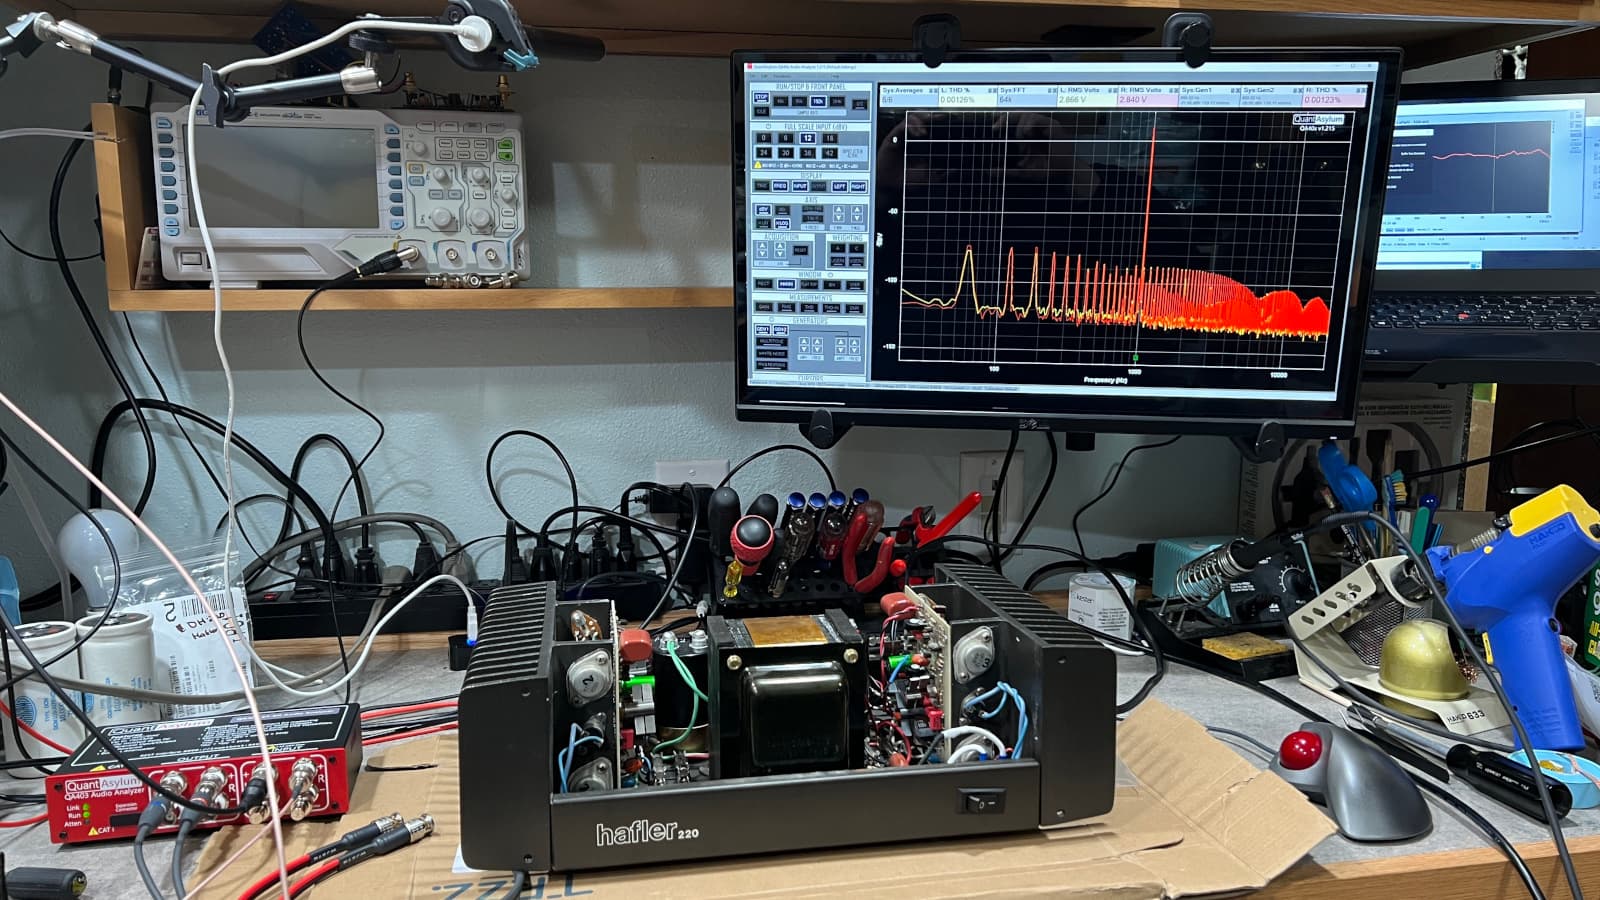
Got most of the parts to refurb the DH-220 yesterday. Replaced all electrolytics, bypassed the big ones with Panasonic PP types, and even replaced most of the film caps on the board since some were looking like they may have seen some heat.
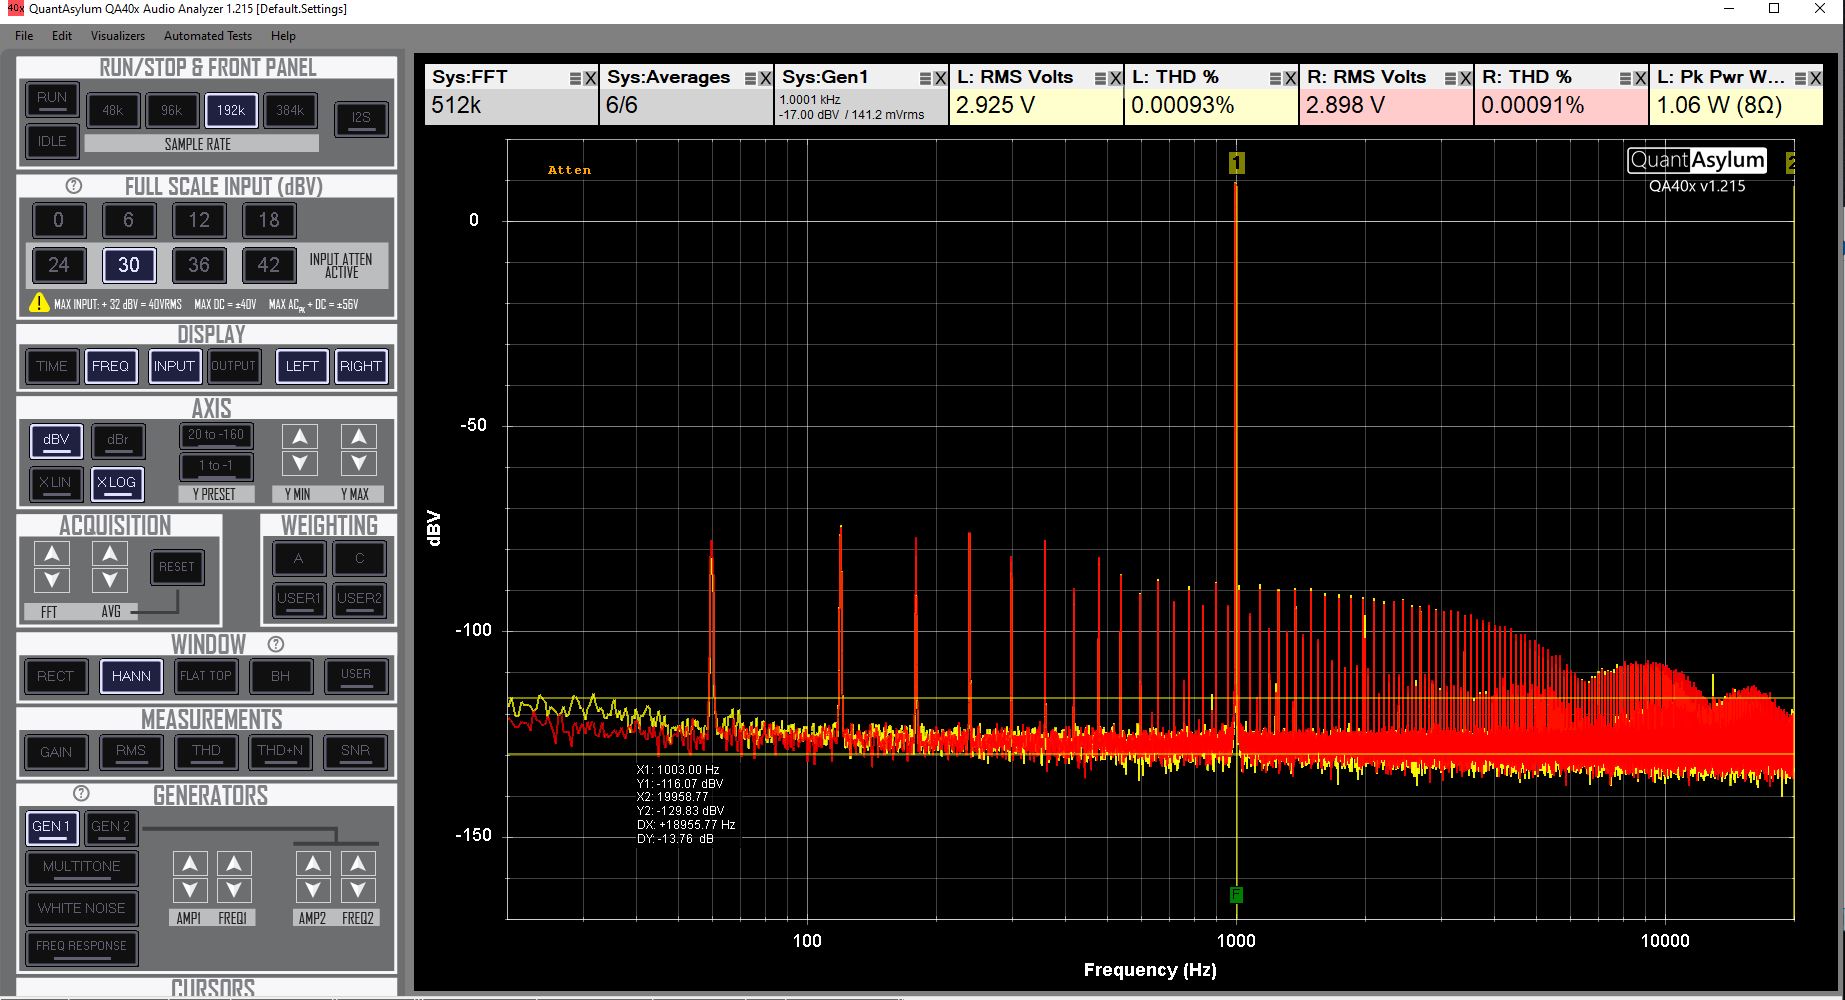
Distortion is surprisingly low. The official spec from Hafler was 0.02%. I’m wondering if I have something wrong in the settings. I can’t run this amp at full power until I upgrade my dummy loads.
I think you should put one on your list to Santa! I had to sell my JBL L112s to justify buying it. But I know I’ll get much more use out of this and it takes up a lot less space!
Your amps are next on the list! I just need to go through the tutorial with this Hafler to make sure I’m setting everything up correctly. Hopefully Scott will see this thread and point out any mistakes I’m making.
I think your measurements look reasonable. I usually wind up with a smaller FFT size (128k) for my standard 1 kHz measurement. I also measure at 5 watts instead of 1 watt. This was originally so I could compare to the Audio Science Review test results by approximating the same conditions. I do agree with the rationale though. At the 1 watt test level, the deviations are almost always dominated by noise rather than distortion while at 5 watts. Anyway, at 5 watts, if I test with a larger FFT size, some of the cheap little class d or other chip amps can get unhappy. Pretty much anything is okay at 128k. When I do automated power sweeps to find the clipping point, I drop FFT size down to 32k so the individual test points go fast and the dummy load can handle a lot more power.
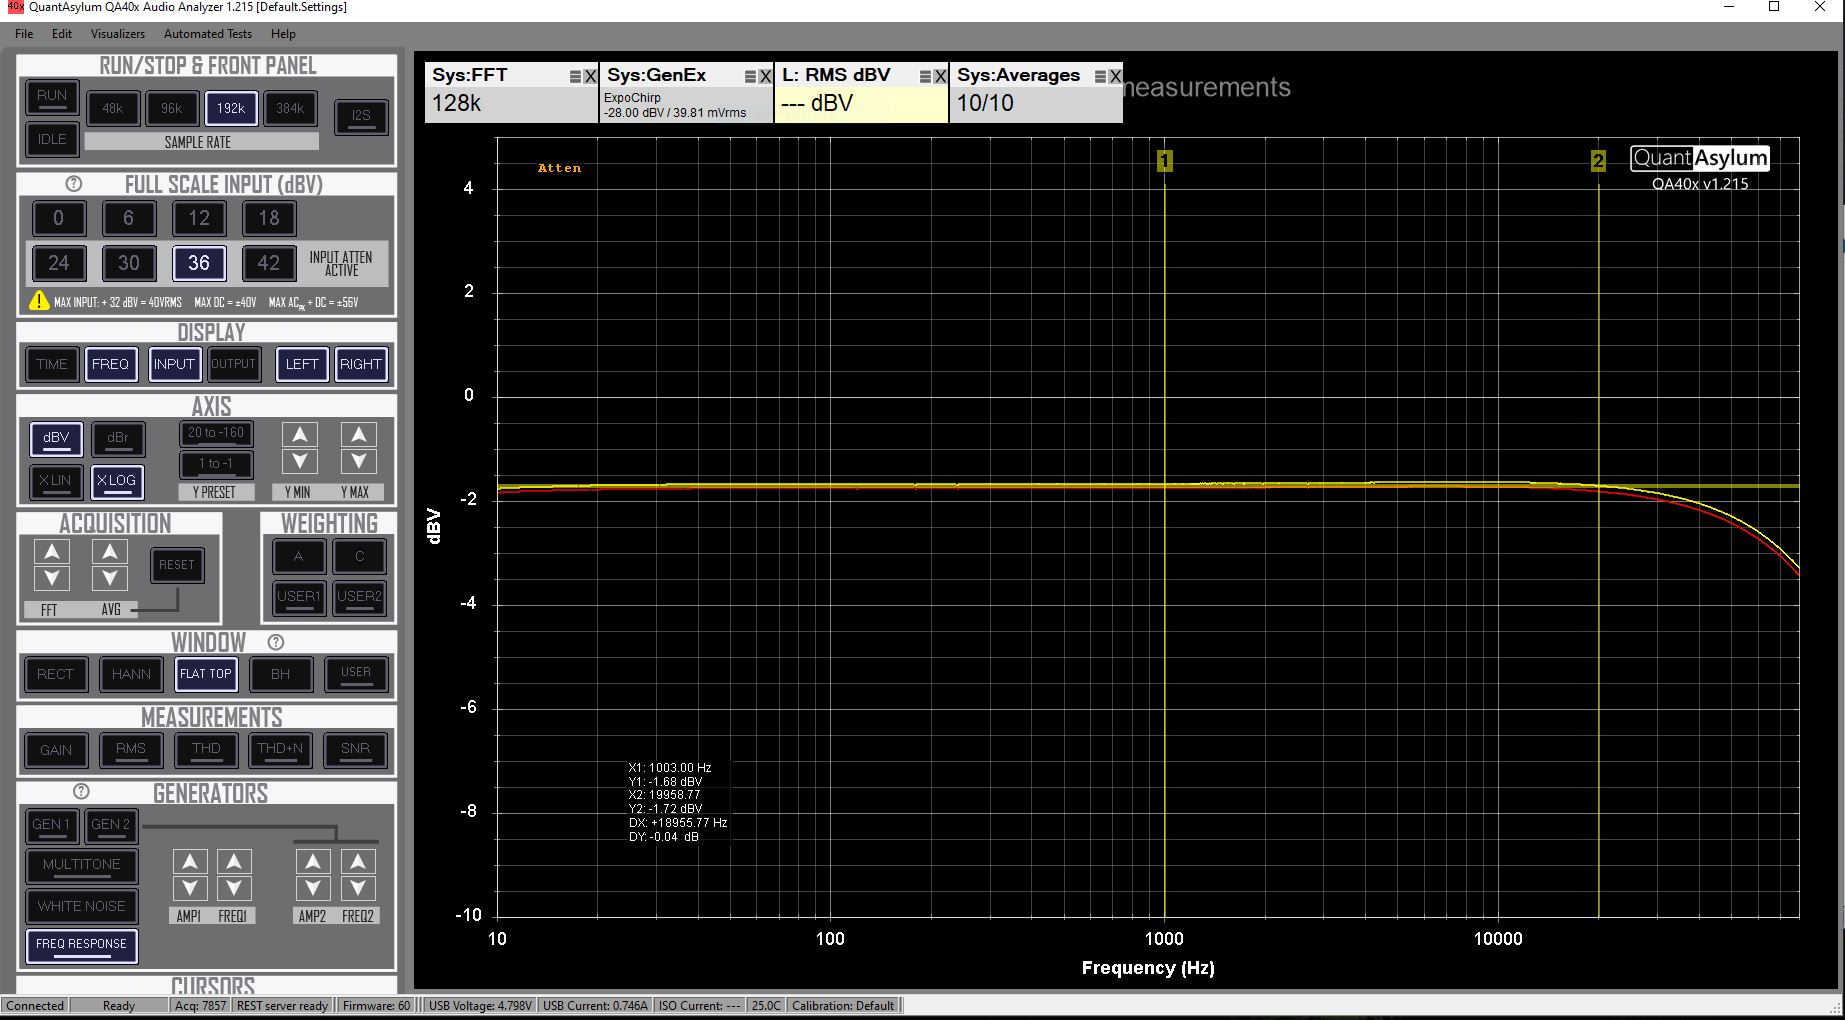
One thing I find helpful is to use dBr instead of dBV for the y axis. That allows setting the peak level to 0 dB on the graph.
I tend to measure THD+N instead of THD - again primarly to compare with ASR’s SINAD measurements. THD+N would have been considerably higher on your Hafler amp at 1 W. In my experience measuring 0.0009% vs. 0.0025% THD spec isn’t that far off. Back then, the better manufacturers tended to err on the conservative side.
Great - thanks for the tips!! I’m still digesting everything covered in Cordell’s tutorial. I hadn’t even thought about FFT size related to power going into the dummy loads.
I also learned there’s some independently developed software that looks interesting - QA40xPlot.